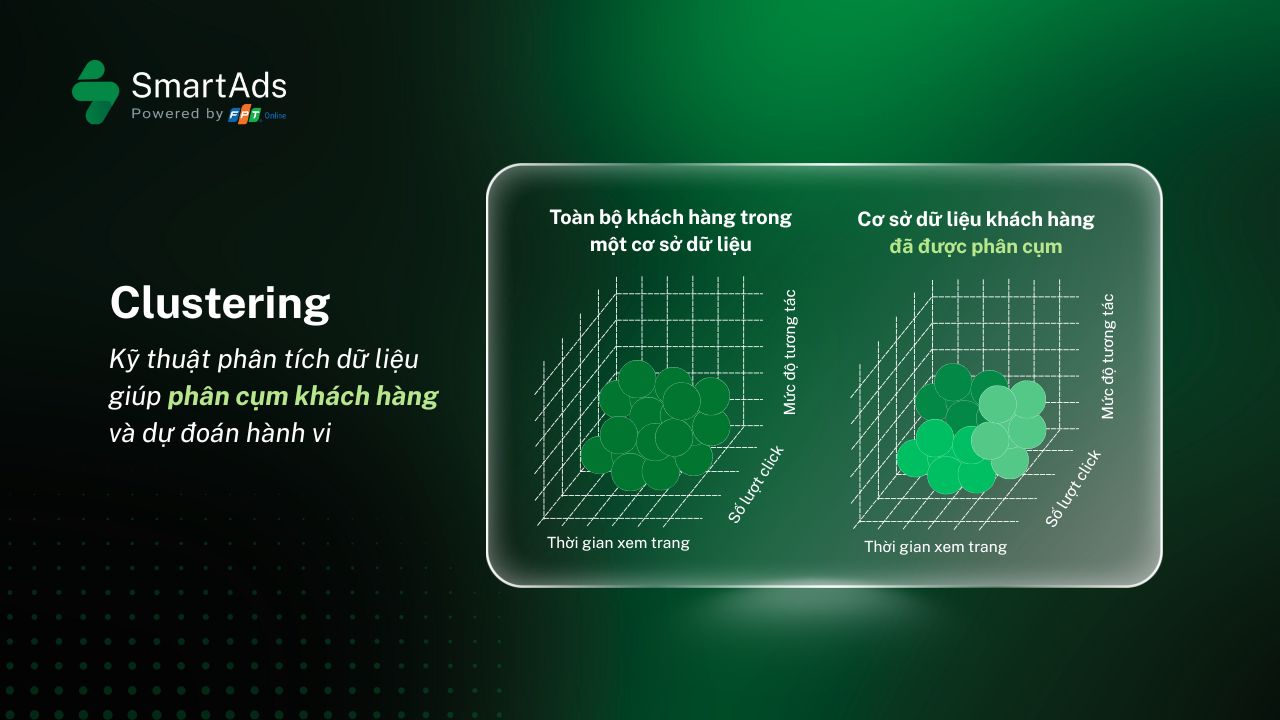
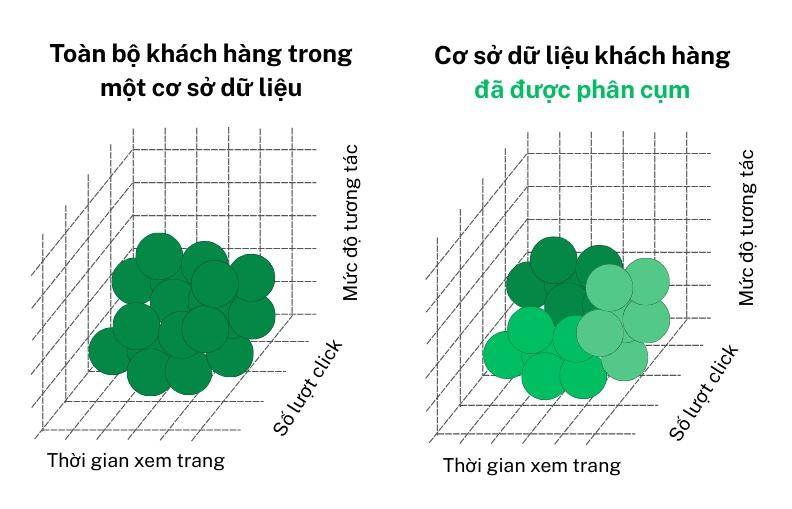
Clustering concept
Clustering (also known as data grouping or cluster analysis) is a data analysis technique used to divide a dataset into multiple smaller groups (called clusters), where objects within the same cluster share similar characteristics, while being clearly distinct from objects in other clusters.
The role of clustering analysis in marketing
In marketing and customer behavior research, clustering enables businesses to identify customer segments with similar behaviors, needs, or attributes—serving as a foundation for personalized marketing strategies, content optimization, and improved campaign performance. Specifically, clustering supports:
-
Customer Segmentation: Clustering helps businesses break down the market into distinct customer segments based on shared characteristics such as purchasing behavior, age, geographic location, and spending level. As a result, marketing campaigns become more precise and highly personalized.
-
Marketing Message Optimization: Once customer clusters are identified, brands can tailor content, visuals, and advertising messages to each segment—significantly increasing engagement and conversion rates.
-
Consumer Behavior Prediction: Customer clustering uncovers recurring behavioral patterns, enabling marketers to forecast purchasing trends, emerging needs, and even identify when customers are likely to churn.
-
Marketing Cost Optimization: Instead of broad, unfocused ad spending, clustering allows businesses to allocate budgets toward high-potential customer segments—reducing waste and maximizing return on investment (ROI).
-
Product and Service Development: Different customer segments have distinct needs. Clustering helps uncover market gaps, enabling businesses to design products, services, or promotional packages tailored to each customer group.
Case Study: Applying clustering analysis in practice
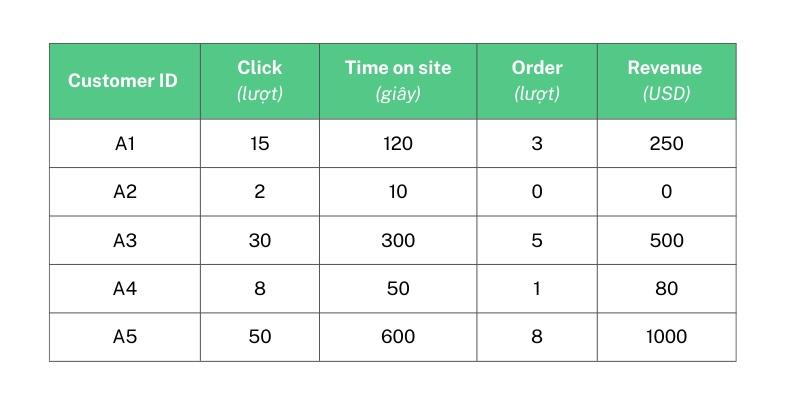
Assume Brand X is analyzing data from an advertising campaign and aims to segment customers based on their behavior to optimize its marketing strategy. The collected data is shown in Table 1 (illustrated below). Brand X can process this data through the following three steps:
Step 1: Data Preprocessing
Before running K-Means, data normalization is required to ensure all variables carry equal weight when calculating distances. Since metrics such as click count, page view duration, number of purchases, and revenue have different units, StandardScaler is used to bring them onto the same scale.
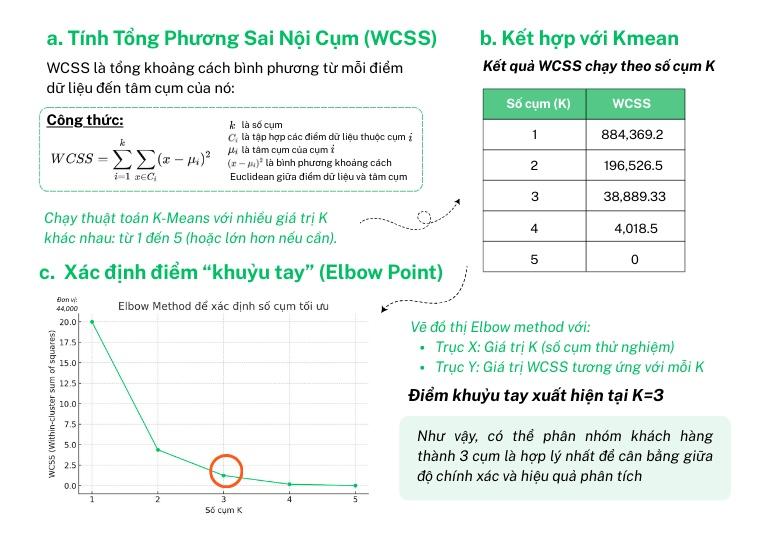
Step 2: Determining the Optimal Number of Clusters (K)
The Elbow Method helps determine the optimal number of clusters in K-Means Clustering by analyzing changes in the Within-Cluster Sum of Squares (WCSS). The process includes the following steps:
Calculate the WCSS for each value of K.
- WCSS reflects how closely data points are grouped within a cluster:
- Lower WCSS → data points are closer → tighter clusters.
- Higher WCSS → data points are more dispersed → suboptimal clustering.
Run K-Means with K values of 1, 2, 3, 4, and 5.
Identify the Elbow Point.
Plot the Elbow Method graph with:
- X-axis: K values (number of clusters tested)
- Y-axis: Corresponding WCSS values and observe the downward trend:
- From K = 1 → 2, WCSS drops sharply (from 884,369.2 to 196,526.5).
- From K = 2 → 3, WCSS continues to decrease significantly (from 196,526.5 to 38,889.33).
- From K = 3 → 4, the decrease becomes marginal (from 38,889.33 to 4,018.5).
- From K = 4 → 5, WCSS approaches zero, meaning each data point forms its own cluster. Therefore, the elbow point appears at K = 3 —indicating that segmenting customers into three clusters achieves the best balance between accuracy and analytical efficiency.
Step 3: Applying the Results
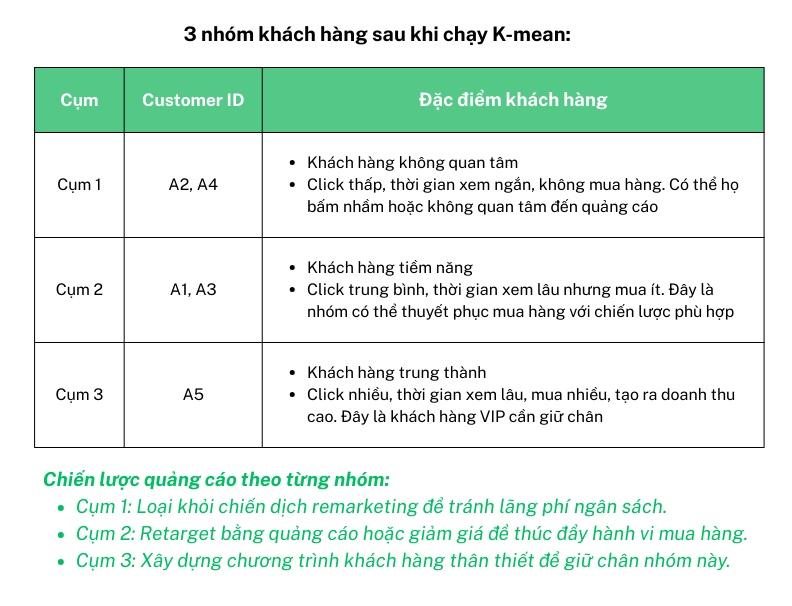
Monitor the three customer clusters identified after running K-Means and adjust marketing strategies accordingly to ensure optimal advertising budget allocation.
- Cluster 1 (Low-engagement, low-value customers): Includes customers with very few clicks, short page view durations, minimal purchases, or no purchases at all.
According to Table 1: Customer IDs 2 and 4 have low click counts (2–8), short viewing time (10–50 seconds), and low revenue (USD 0–80).
Strategy: Exclude from remarketing campaigns to avoid unnecessary budget waste.
- Cluster 2 (Mid-value customers with fairly good engagement):
This group includes customers with moderate click frequency, page view duration, and purchase volume—neither too high nor too low.
According to Table 1: Customer IDs 1 and 3 recorded 15–30 clicks, 120–300 seconds of viewing time, and 3–5 purchases.
Strategy: Retarget with tailored ads or promotional discounts to encourage additional purchases.
- Cluster 3 (High-potential, high-value customers): Consists of customers with strong engagement, frequent purchases, and high revenue contribution.
According to Table 1: Customer ID 5 recorded 50 clicks, 600 seconds of page viewing, 8 purchases, and USD 1,000 in revenue.
Strategy: Retarget with premium offers, personalized messaging, or loyalty incentives to maximize lifetime value.
Conclusion
Clustering is a powerful data analysis tool that helps businesses clearly identify similarities and differences within their customer base, enabling more personalized marketing strategies with optimized cost efficiency. Beyond delivering the right message to the right audience at the right time, data-driven customer segmentation also unlocks opportunities to enhance products, services, and the overall customer experience.