
Danh sách các nhóm chỉ số báo cáo trong SmartAds
(Cập nhật: 02/2026)
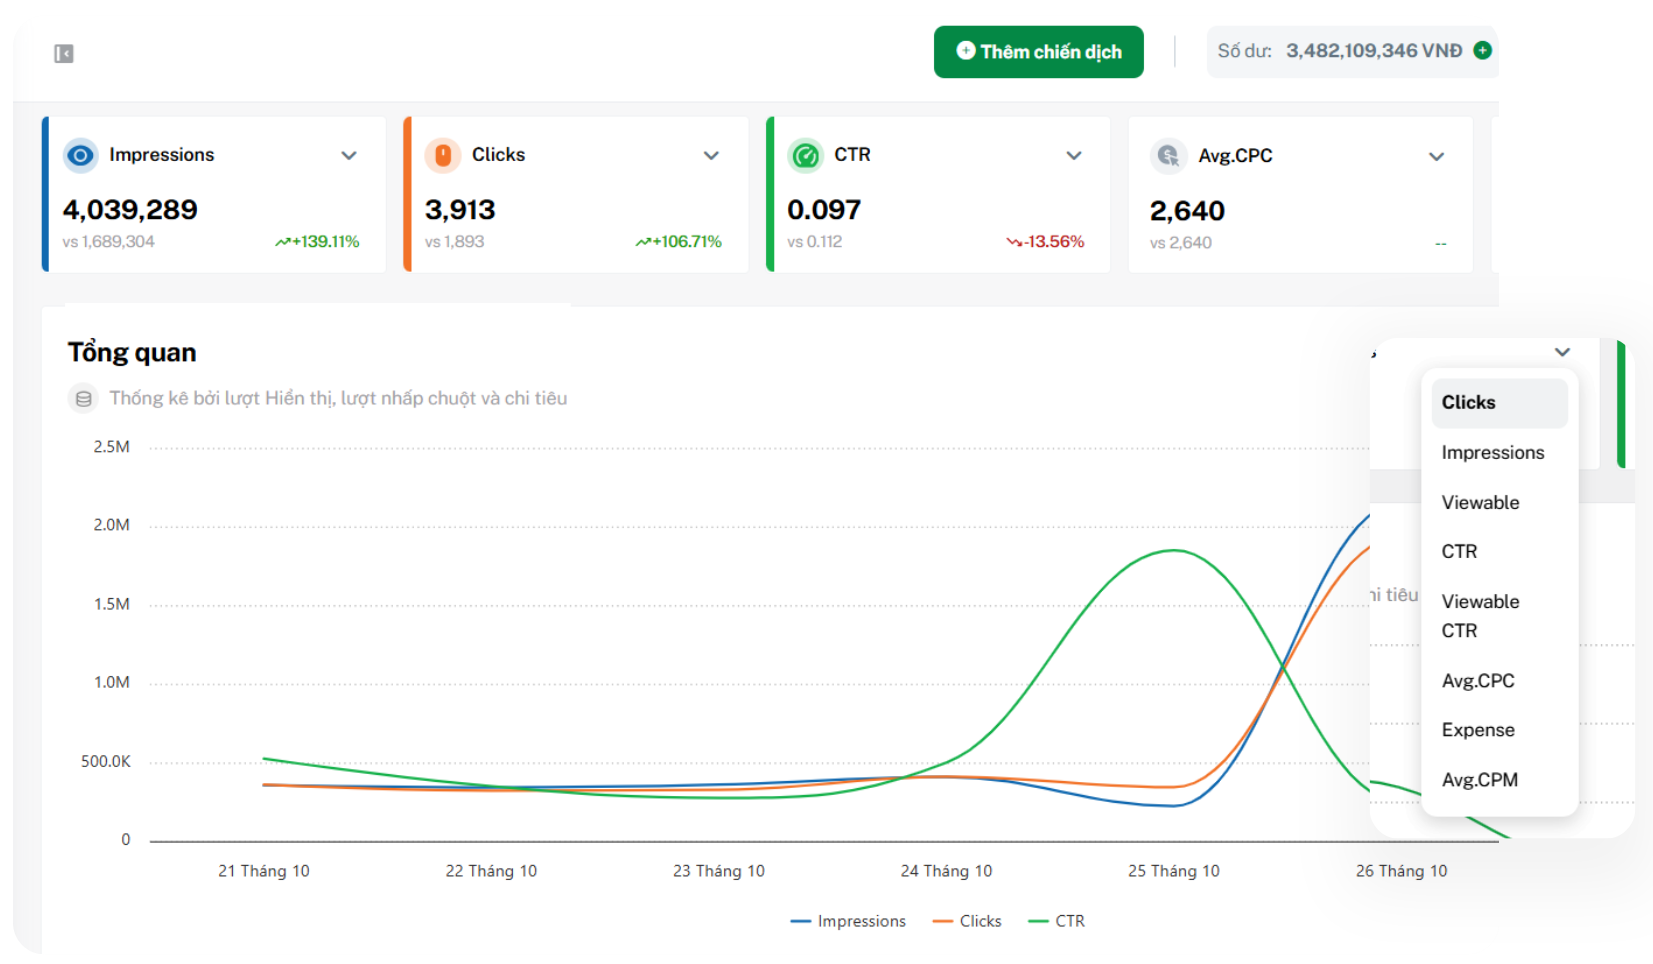
Các chỉ số báo cáo của SmartAds được chia thành 4 nhóm chính:
-
Nhóm 1: Chỉ số chi phí & phân phối
-
Nhóm 2: Chỉ số hiển thị & tiếp cận
-
Nhóm 3: Chỉ số tương tác
-
Nhóm 4: Chỉ số video Ads
Chi tiết về các nhóm chỉ số như sau:
1. Nhóm chỉ số chi phí và phân phối ngân sách (Cost and Delivery Metrics)
Đây là nhóm chỉ số giúp advertiser theo dõi ngân sách đã sử dụng và mức độ phân phối quảng cáo trên hệ thống. Các chỉ số trong nhóm này cho biết quảng cáo đang tiêu tốn ngân sách ở mức nào, chi phí trung bình cho từng đơn vị phân phối ra sao và mức độ hiệu quả khi tiếp cận người dùng.
1.1. Expense - Chi tiêu
Expense là tổng số tiền advertiser đã chi cho chiến dịch trong khoảng thời gian được lựa chọn. Chỉ số này giúp advertiser theo dõi tiến độ chi tiêu ngân sách trên hệ thống SmartAds từ đó đánh giá mức độ phù hợp giữa ngân sách kế hoạch và hiệu suất thực tế của chiến dịch.
-
Công thức: Expense = Tổng ngân sách advertiser đã sử dụng trong khoảng thời gian tùy chỉnh
-
Đơn vị tính: VNĐ
1.2. CPM - Chi phí cho mỗi 1.000 lượt hiển thị
CPM (Cost per Mille) là chi phí trung bình để quảng cáo hiển thị 1.000 lần nằm trong vùng nhìn thấy trên hệ thống SmartAds.
-
Công thức: CPM = Tổng chi phí quảng cáo / Lượt hiển thị được nhìn thấy (True Impressions) x 1000
-
Đơn vị tính: VNĐ
1.3. CPC - Chi phí cho mỗi lượt nhấp chuột
CPC (Cost per Click) là chi phí trung bình mà advertiser phải trả cho mỗi lượt người dùng nhấp vào quảng cáo của SmartAds để truy cập trang đích.
-
Công thức: CPC = Tổng chi phí quảng cáo / Tổng lượt nhấp chuột (Clicks)
-
Đơn vị tính: VNĐ
CPC giúp advertiser đánh giá khả năng thu hút và thuyết phục của nội dung quảng cáo, đặc biệt trong các chiến dịch tập trung vào traffic.
1.4. CPV - Giá mỗi lượt xem video (6 giây)
CPV (Cost per View) là chi phí trung bình cần trả cho mỗi lượt người dùng xem video quảng cáo của SmartAds đạt mốc tối thiểu 6 giây, hoặc xem toàn bộ video nếu video có thời lượng bằng hoặc ngắn hơn 6 giây.
-
Công thức: CPV = Tổng chi phí quảng cáo / Tổng lượt xem video tối thiểu 6 giây (6-second Video Plays)
-
Đơn vị tính: VNĐ
CPV giúp advertiser đánh giá hiệu quả chi phí của quảng cáo video trong việc thu hút sự chú ý ban đầu của người xem.
1.5. CPCV - Giá mỗi lượt xem hết video
CPCV (Cost per Completed View) là chi phí trung bình mà advertiser phải trả cho mỗi lượt người dùng xem hết 100% thời lượng video quảng cáo. Chỉ số này phản ánh trực tiếp chất lượng nội dung và khả năng giữ chân người xem của video.
-
Công thức: CPCV = Tổng chi phí quảng cáo / Tổng lượt xem hoàn chỉnh (Video Plays at 100%)
-
Đơn vị tính: VNĐ
2. Nhóm Chỉ số hiển thị và tiếp cận (Delivery and Visibility Metrics)
Giúp đánh giá khả năng quảng cáo được nhìn thấy thực sự bởi người dùng, thay vì chỉ xuất hiện về mặt kỹ thuật.
2.1. Impression - Lượt hiển thị
Impression là số lần quảng cáo SmartAds được hiển thị trên trang báo. Hệ thống tự động ghi nhận mỗi lần quảng cáo xuất hiện, kể cả trong trường hợp người dùng chưa kéo tới vị trí quảng cáo.
-
Đơn vị tính: Lượt
2.2. Viewable Impression (True Impression) - Lượt quảng cáo được nhìn thấy
Viewable Impression (Hay True Impression) là số lần quảng cáo của SmartAds được hiển thị và có ít nhất 50% diện tích nằm trong khung nhìn của người dùng. Đây là chỉ số phản ánh chất lượng hiển thị thực tế thay vì chỉ hiển thị về mặt kỹ thuật.
-
Đơn vị tính: Lượt
2.3. Reach - Lượt tiếp cận
Lượt tiếp cận cho biết số lượng người dùng duy nhất đã nhìn thấy quảng cáo do hệ thống tự động ghi nhận theo FO ID, được cập nhật sau 0:00 hằng ngày. Đây là chỉ số quan trọng để đánh giá độ phủ của chiến dịch, trả lời câu hỏi quảng cáo đã chạm được bao nhiêu người trong tập khách hàng mục tiêu.
-
Đơn vị tính: Lượt người dùng
2.4. Frequency - Tần suất hiển thị
Frequency là số lần trung bình một người dùng đã nhìn thấy quảng cáo trong khoảng thời gian đo lường. Chỉ số này cho biết mức độ lặp lại thông điệp quảng cáo trên mỗi người dùng, từ đó giúp advertiser kiểm soát độ “phủ sâu” của chiến dịch.
- Công thức: Frequency = Tổng lượt hiển thị thực tế (True Impression) / Tổng lượt tiếp cận (Reach)
- Đơn vị tính: Lượt / người dùng
Tần suất quá thấp có thể khiến thông điệp chưa đủ ghi nhớ, trong khi tần suất quá cao có nguy cơ gây nhàm chán hoặc phản cảm cho người xem. Vì vậy, Frequency thường được theo dõi song song với Reach để tối ưu giữa độ rộng và độ sâu của phân phối quảng cáo.
3. Nhóm Chỉ số tương tác (Engagement Metrics)
Nhóm chỉ số tương tác phản ánh mức độ người dùng chủ động phản hồi với quảng cáo sau khi nhìn thấy.
3.1. Clicks - Lượt nhấp chuột
Clicks là số lần người dùng nhấp vào quảng cáo của SmartAds để truy cập trang đích. Clicks phản ánh mức độ quan tâm và hành động trực tiếp của người dùng đối với quảng cáo.
-
Công thức: Click = Tổng số lượt nhấp vào quảng cáo
-
Đơn vị tính: Lượt nhấp
3.2. CTR - Tỷ lệ nhấp chuột
CTR (Click Through Rate) là tỷ lệ phần trăm giữa số lượt nhấp chuột và tổng số lượt hiển thị quảng cáo. CTR cho biết mức độ hấp dẫn của quảng cáo, nhưng cần đánh giá kết hợp với chất lượng traffic.
-
Công thức: CTR = (Tổng lượt nhấp chuột / Tổng lượt hiển thị) x 100
-
Đơn vị tính: %
3.3. Viewable CTR (True CTR) - Tỷ lệ nhấp chuột theo lượt nhìn thấy
Viewable CTR là tỷ lệ giữa số lượt nhấp chuột và tổng số lượt quảng cáo được nhìn thấy (True Impression). Chỉ số này phản ánh chính xác hơn hiệu quả nội dung vì chỉ tính trên các lượt hiển thị thực sự.
-
Công thức: True CTR = (Tổng lượt nhấp chuột / Tổng lượt hiển thị được nhìn thấy) x 100
-
Đơn vị tính: %
Ngoài ra, khi hoàn tất thiết lập UTM tracking và SmartAds Pixel trên website bán hàng, bạn có thể theo dõi thêm các chỉ số tương tác trên landing page như sau:
-
Avg. time on site (s): Thời gian trung bình người dùng ở lại trên website, phản ánh mức độ quan tâm và khả năng giữ chân khách truy cập.
-
Avg. depth scrolls (%): Tỷ lệ phần trăm nội dung trang mà người dùng đã cuộn qua, giúp đánh giá mức độ tương tác và mức độ hấp dẫn của bố cục nội dung.
-
Sessions: Tổng số phiên truy cập được ghi nhận trong khoảng thời gian đo lường, cho biết tần suất người dùng quay lại hoặc truy cập mới vào website.
-
Pageviews: Số lần các trang trong website được tải và hiển thị, thể hiện mức độ quan tâm của người dùng với nội dung cụ thể.
-
Events (bản beta): Ghi nhận số lượng hành động tương tác của người dùng trên website như nhấp nút, điền form hoặc xem video.
-
CPA (bản beta): Chi phí trung bình cho mỗi hành động chuyển đổi, giúp đánh giá hiệu quả đầu tư quảng cáo theo mục tiêu cụ thể.
>>> Hướng dẫn thiết lập UTM tracking và SmartAds Pixel.
4. Nhóm chỉ số video và hành vi xem (Video Performance Metrics)
Nhóm chỉ số video giúp advertiser phân tích hành vi xem, mức độ giữ chân và hiệu quả nội dung video quảng cáo.
>>> Làm sao để đọc các chỉ số video Ads? Xem thêm tại đây.
4.1. Video Plays - Lượt xem video
Video Plays là số lần video được phát tối thiểu 1ms, không bao gồm lượt phát lại (replay).
-
Đơn vị tính: Lượt
4.2. 3-second Video Plays - Lượt xem tối thiểu 3 giây
Là số lần video được xem ít nhất 3 giây, không tính thời gian phát lại.
-
Đơn vị tính: Lượt
4.3. 6-second Video Plays - Lượt xem tối thiểu 6 giây
Là số lần video được xem ít nhất 6 giây hoặc xem toàn bộ nếu video ngắn hơn 6 giây.
-
Đơn vị tính: Lượt
4.4. Watch Time - Tổng thời gian xem
Watch Time là tổng thời gian người dùng xem video quảng cáo, tính bằng giây và không bao gồm replay.
-
Công thức: Watch Time = Tổng thời gian xem của tất cả lượt phát
-
Đơn vị tính: Giây
4.5. Avg. Play Time - Thời gian xem trung bình
Avg. Play Time là thời gian trung bình mà một người dùng dành để xem video quảng cáo.
-
Công thức: Avg. Play Time = Watch Time / Tổng lượt xem video
-
Đơn vị tính: Giây
4.6. Video Plays at 25% / 50% / 75% / 100% - Lượt xem theo mốc thời lượng
Là số lượt xem đạt đến các mốc 25%, 50%, 75% và 100% thời lượng video, phản ánh khả năng giữ chân người xem theo từng giai đoạn nội dung.
-
Đơn vị tính: Lượt
4.7. View Rate - Tỷ lệ xem
View Rate là tỷ lệ giữa số lượt xem video và tổng số lượt hiển thị quảng cáo.
-
Công thức: View Rate = Video Plays / Impression
-
Đơn vị tính: %
View Rate cho thấy mức độ người dùng dừng lại xem video khi quảng cáo được hiển thị.
5. Key takeaways cho advertiser khi áp dụng các chỉ số trên
-
Không chỉ nhìn chi phí, hãy nhìn chất lượng phân phối: Các chỉ số như Viewable Impression, Viewable CTR và Frequency giúp thương hiệu đánh giá quảng cáo có thực sự được nhìn thấy và ghi nhớ, thay vì chỉ “đã hiển thị” về mặt kỹ thuật.
-
Cân bằng giữa độ phủ và độ lặp: Reach phản ánh quy mô tiếp cận, trong khi Frequency cho biết mức độ lặp lại thông điệp trên mỗi người dùng. Kết hợp hai chỉ số này giúp tối ưu độ nhận diện mà không gây quá tải cho người xem.
-
Hiệu quả nội dung quyết định hiệu quả chi phí: CPC, CTR, CPV và CPCV cho thấy rõ mức độ hấp dẫn của creative. Chi phí thấp chỉ thực sự có ý nghĩa khi đi kèm với tương tác và hành vi xem tích cực.
-
Video cần được đo bằng hành vi xem, không chỉ lượt phát: Các mốc 3s, 6s, tỷ lệ xem và tỷ lệ xem hết phản ánh khả năng giữ chân và truyền tải thông điệp của video, đặc biệt quan trọng với chiến dịch branding.
-
Đo lường toàn phễu để tối ưu bền vững: Khi kết hợp SmartAds Pixel và UTM, thương hiệu có thể nối liền dữ liệu từ hiển thị, tương tác đến hành vi trên website, từ đó đưa ra quyết định tối ưu ngân sách và nội dung dựa trên hiệu quả thực tế.