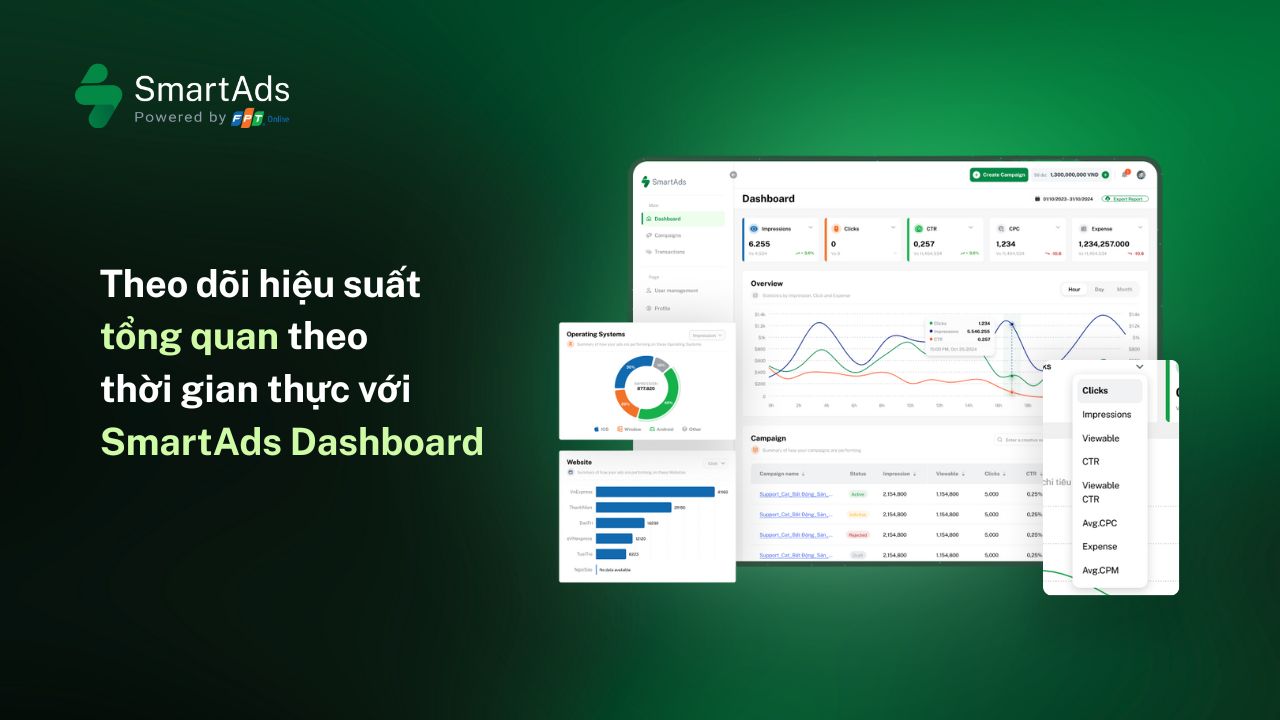
1. Overview Dashboard
The SmartAds Dashboard provides a comprehensive overview of all advertising activities running on the SmartAds platform. More than just a high-level snapshot of campaign performance, this advertising dashboard allows advertisers to flexibly customize and select key metrics to monitor, ensuring alignment with specific business and optimization goals.
Key features:
-
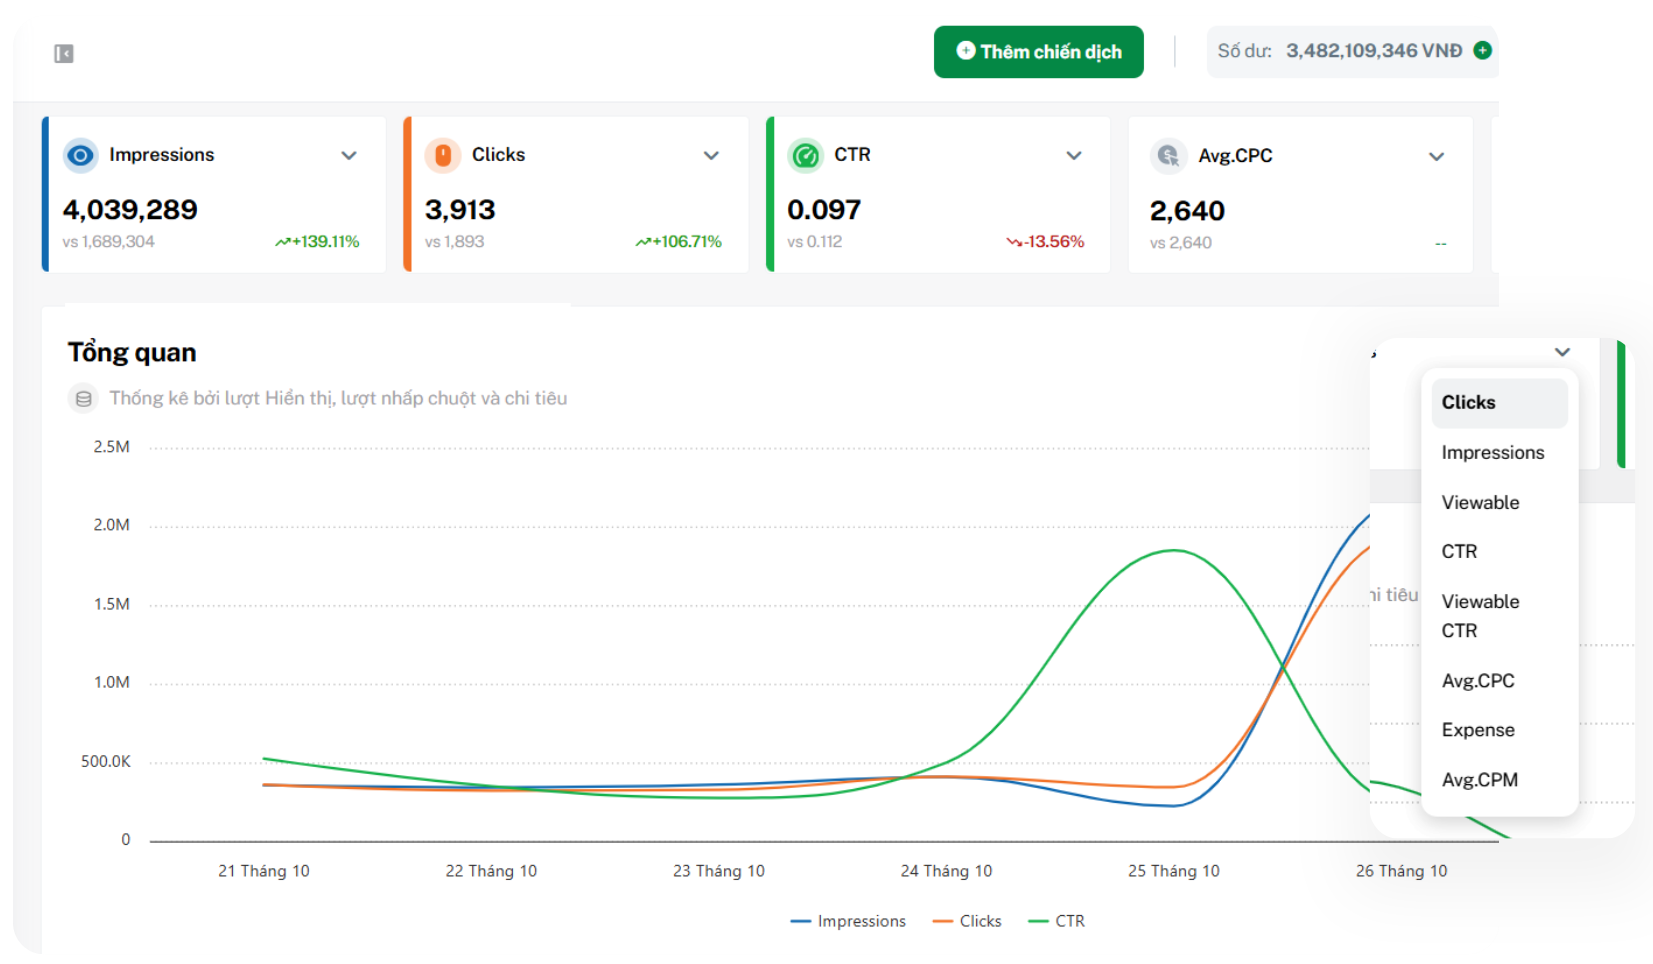
Trend visualizations: Quickly identify performance changes by hour, day, or month. These charts help advertisers monitor fluctuations and detect early signals of growth or decline, enabling timely campaign optimization decisions.
-
Real-time data: Continuously updates core metrics such as impressions, click-through rate (CTR), ad spend, and engagement in real time.
-
Audience performance analysis: Displays advertising effectiveness by campaign, platform, publisher website, time slot, and audience segment, supporting deeper marketing analytics.
-
Flexible customization: Allows users to select and arrange displayed metrics based on their needs. This personalized view helps advertisers focus on the KPIs that deliver the highest value for each campaign.
2. Detailed reporting page
2.1. Management hierarchy in Campaign Reports
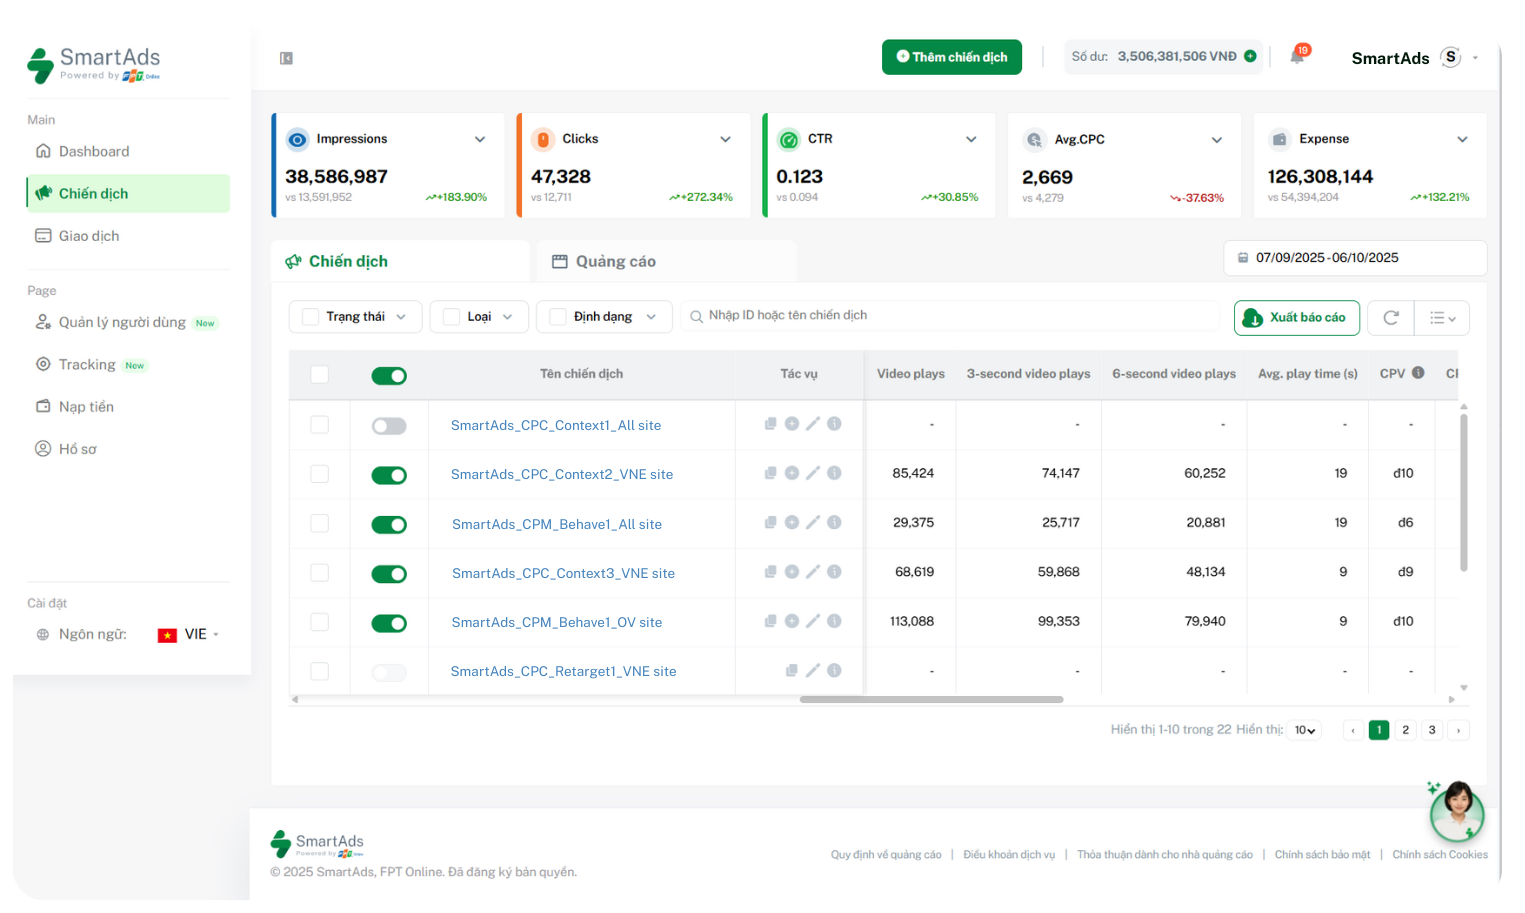
While the Dashboard offers a holistic view, the Campaign Report page enables advertisers to drill down into individual campaigns. Currently, SmartAds applies two advertising hierarchy levels:
-
Campaign level: This is where advertisers define campaign objectives, select target audiences, set budgets, scheduling, and ad placements.
-
Creative level: This level is used to add specific ad creatives, including image or video formats, headlines, description copy, call-to-action (CTA) buttons, and destination URLs.
Thanks to this structure, advertisers can easily view performance data at each level and quickly adjust campaigns or creatives based on actual results.
2.2. On-page controls and actions
The system supports direct in-page actions, allowing users to edit or update campaigns directly from the action bar, as well as export reports for reconciliation or internal documentation. Key functionalities include:
 : Duplicate campaigns or creatives: When a campaign or creative performs well, advertisers can save time by duplicating it and making minor adjustments to scale performance.
 : Add new creatives to a campaign: Enables changes to messaging such as headlines, descriptions, images, or URLs within the same campaign to support A/B testing, optimize delivery efficiency, and expand reach to target audiences.
 : Edit campaigns or creatives: Certain basic edits such as budget, schedule, or targeting adjustments may not require re-approval. However, significant changes like updating images, videos, products, or core messaging will require re-review to ensure compliance with display policies before resuming delivery.
 : View detailed campaign or creative reports: Allows tracking of all performance metrics (impressions, clicks, CTR, CPC, spend, etc.) by campaign or individual creative. Users can also review change history, including what was updated, by whom, and when—ensuring transparency in campaign management.
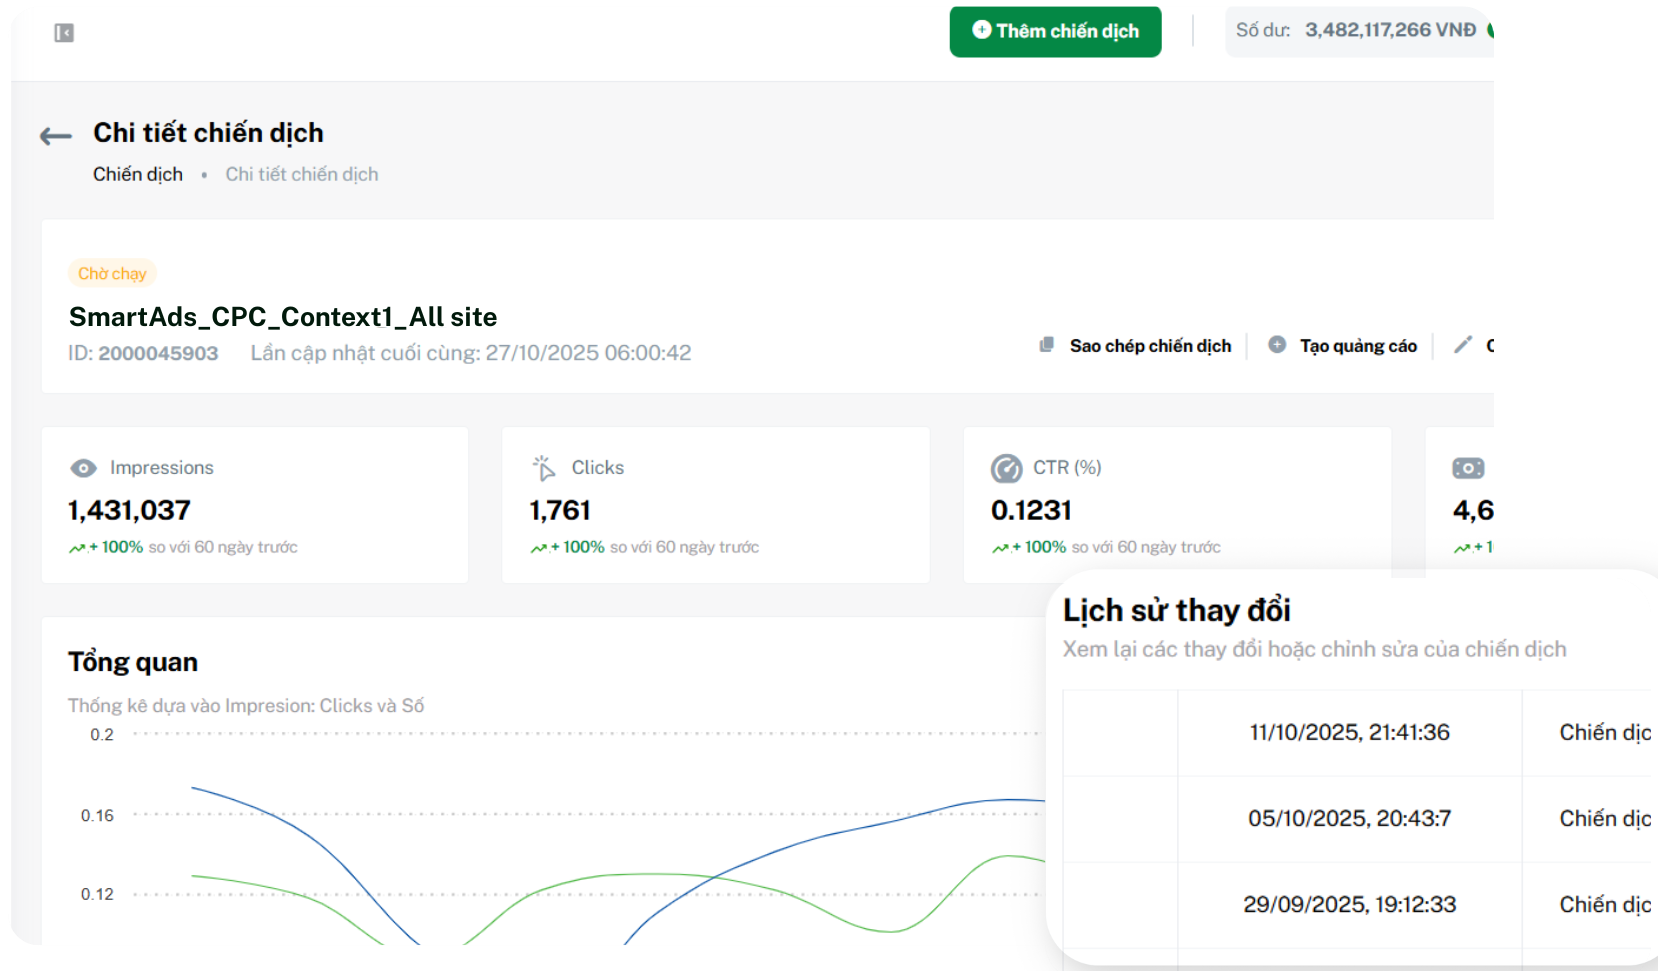
All data is automatically synchronized and updated in real time. As a result, advertisers can easily control budgets, monitor performance metrics, and make timely optimization decisions without complex manual operations.
3. Advertising performance metrics on SmartAds
The SmartAds reporting system delivers a comprehensive set of standardized metrics, covering ad delivery, campaign performance, and landing page engagement. These metrics accurately reflect the value of every advertising dollar spent and support marketers in evaluating, comparing, and optimizing campaigns with data-driven confidence.
Main metric groups include:
-
Expense: Represents the total amount spent during the selected time period, helping advertisers control budgets and evaluate ROI.
-
Impressions: Records the number of times an ad is served, regardless of whether it appears within the visible viewport.
-
Viewable impressions (True impressions): Indicates the number of times at least 50% of the ad was actually visible to users, providing a more accurate measure of real exposure.
-
Clicks: The number of times users actively interact with an ad by clicking through to the destination page. On SmartAds, clicks are recorded only after the system filters out click fraud—invalid or fraudulent clicks—ensuring brands pay only for genuine, value-driven interactions.
-
Click-through rate (CTR) and Viewable CTR: Measure ad attractiveness and engagement by comparing clicks against total impressions or viewable impressions.
-
Cost per click (CPC): Helps advertisers understand cost structure by identifying the average amount paid for each click.
-
Cost per 1,000 impressions (CPM): Indicates the average cost for 1,000 impressions. On SmartAds, CPM is calculated based on viewable impressions (True impressions), ensuring budgets are spent on impressions with real visibility and impact—ultimately improving efficiency and reach quality.
For video ad formats, SmartAds tracks additional performance metrics across multiple engagement levels:
-
Video plays: The number of times a video is played for at least 1 millisecond, excluding replays. Each video impression is counted as a separate play.
-
3-second video plays: The number of views lasting at least 3 seconds, reflecting initial content engagement (excluding replays).
-
6-second video plays: The number of views lasting at least 6 seconds, or full views for shorter videos, indicating early-stage viewer retention.
-
Watch time: Total time users spend watching video ads, measured in seconds and excluding replays. For example, 1,000 views with an average duration of 12 seconds equals 12,000 seconds of watch time.
-
Avg. play time: The average watch duration per play, calculated as total watch time divided by total video plays.
-
CPV (Cost per View): The average cost for each view lasting at least 6 seconds, reflecting budget efficiency based on real engagement.
-
CPCV (Cost per Completed View): The average cost for each fully completed video view, helping brands assess the investment required to achieve full content consumption.
-
Video plays at 25%: The number of viewers who watched at least 25% of the video, indicating early interest.
-
Video plays at 50%: The number of viewers who reached the midpoint of the video, reflecting mid-content engagement.
-
Video plays at 75%: The number of viewers who watched at least 75% of the video, signaling strong message relevance.
-
Video plays at 100%: The number of complete views, demonstrating high creative quality and audience resonance.
-
View rate: The ratio of video views to total impressions, indicating overall video attraction effectiveness.
Additionally, once UTM tracking and the SmartAds Pixel are fully implemented on the landing page, advertisers can track deeper on-site engagement metrics:
-
Avg. time on site (s): The average duration users stay on the website, reflecting interest level and content stickiness.
-
Avg. scroll depth (%): The percentage of page content users scroll through, helping evaluate layout effectiveness and content engagement.
-
Sessions: The total number of recorded visits within the selected time frame, indicating both new and returning traffic.
-
Pageviews: The number of times website pages are loaded and displayed, reflecting user interest in specific content.
-
Events (beta): Tracks user interaction actions on the website such as button clicks, form submissions, or video views.
-
CPA (beta): The average cost per conversion action, helping advertisers measure performance against defined conversion goals.
Note: Event and CPA metrics are currently in beta. Due to differences in event configuration methods and algorithms, these metrics on SmartAds may vary from those reported in Google Analytics.
>>> View the step-by-step guide to setting up UTM tracking and the SmartAds Pixel here.