Hiểu lầm phổ biến: Cắt ngân sách theo chỉ số ngắn hạn, bỏ qua vai trò từng kênh
Một thương hiệu bắt đầu chiến dịch bằng cách chia ngân sách đều các kênh: Google Search, Social Ads, Display, Trade... Sau 2 ngày thử nghiệm, nhóm nào có CTR tốt, CPL thấp là được giữ lại, phần còn lại bị cắt giảm ngân sách hoặc dừng hẳn. Nghe có vẻ hợp lý, tuy nhiên việc đánh giá hiệu quả kênh chỉ dựa trên các chỉ số bề mặt mà không nhìn vào vai trò của từng kênh trong hành trình khách hàng có thể dẫn đến chiến dịch mất cân bằng và lãng phí ngân sách. Trên thực tế, kênh có chỉ số thấp hơn chưa chắc là kênh kém hiệu quả mà nguyên nhân có thể là vì nó mắt xích không thể thiếu trong phễu chuyển đổi.
Dưới đây là những phương pháp sẽ giúp đánh giá lại cách đo lường hiệu quả chiến dịch marketing theo hướng mang tính chiến lược hơn, đúng vai trò từng kênh – thay vì chỉ "test rồi cắt" một cách ngắn hạn.
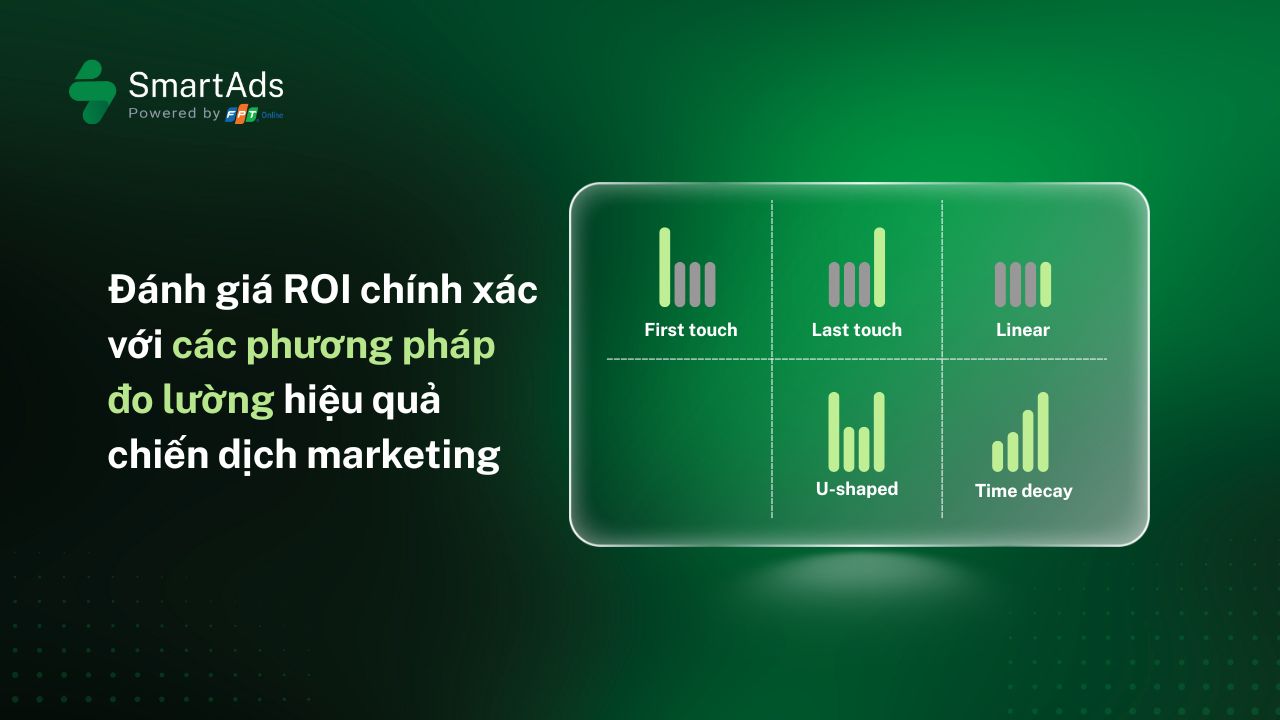
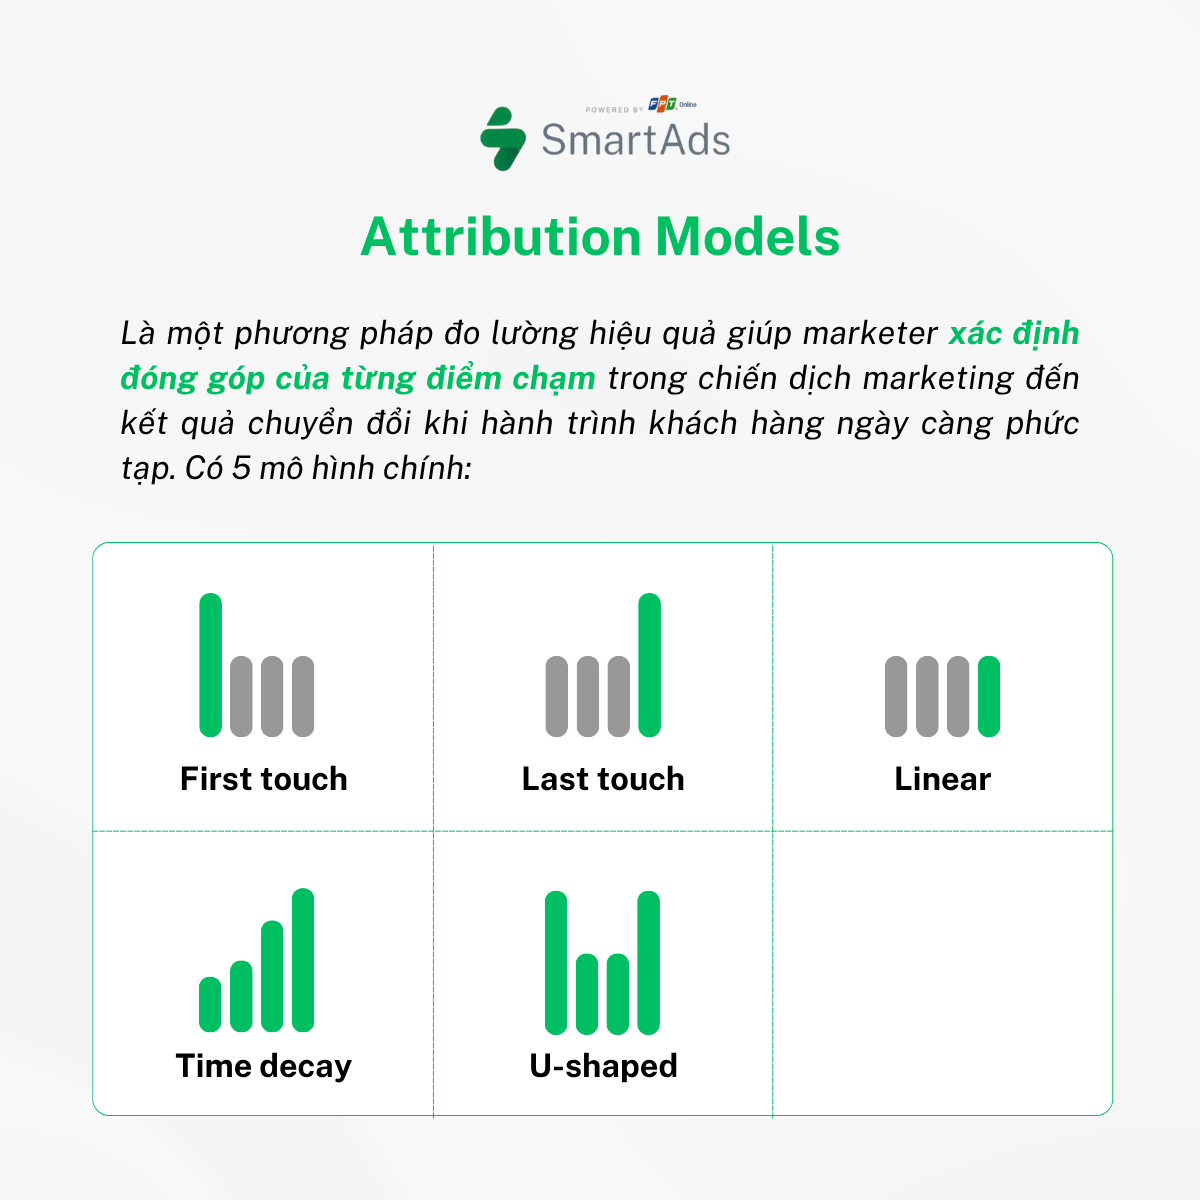
1. Attribution model – Mô hình phân bổ giá trị đóng góp của từng điểm tiếp xúc
Attribution model là một trong các phương pháp đo lường hiệu quả giúp marketer hiểu rõ từng hoạt động trong chiến dịch marketing đóng góp như thế nào vào kết quả chuyển đổi, đặc biệt khi hành trình khách hàng ngày càng phức tạp và phi tuyến tính. Phương pháp này gồm 5 phân loại chính dựa trên vị trí điểm tiếp xúc:
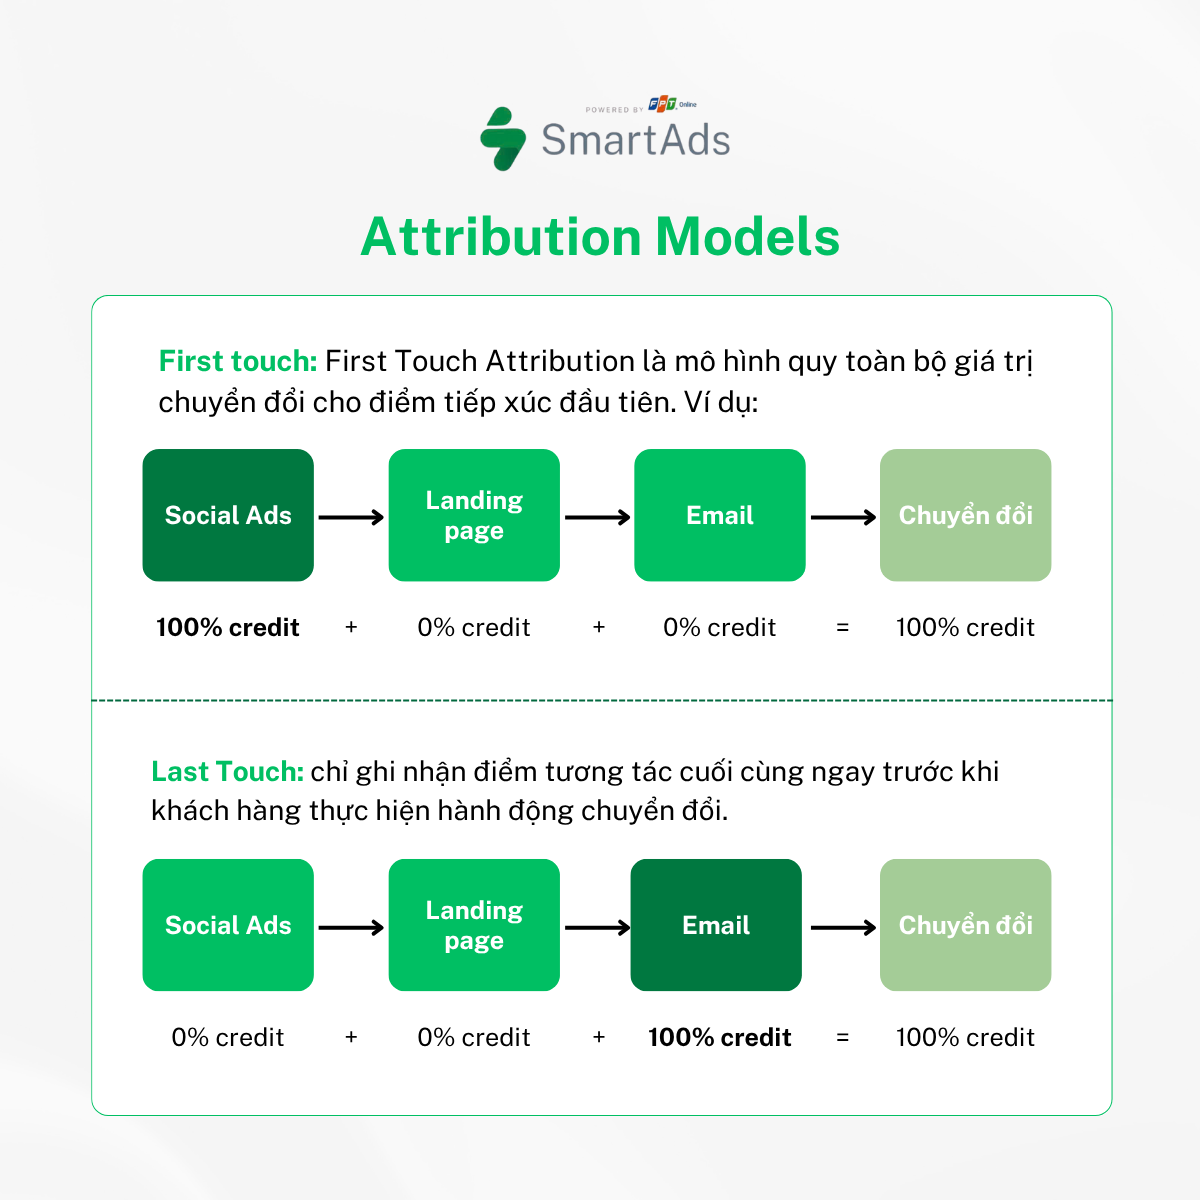
1.1. First Touch - Điểm chạm đầu tiên
First Touch Attribution là mô hình quy toàn bộ giá trị chuyển đổi cho điểm tiếp xúc đầu tiên giữa khách hàng và thương hiệu. Mô hình này coi điểm chạm đầu là yếu tố quan trọng nhất, đóng vai trò khởi đầu cho hành trình chuyển đổi của khách hàng.
First Touch phù hợp khi doanh nghiệp cần xác định các kênh, nội dung hoặc chiến dịch tạo nhận thức ban đầu hiệu quả nhất, đặc biệt trong các hoạt động chiến dịch marketing đầu phễu.
Ưu điểm
Mô hình đơn giản, dễ thiết lập và giúp doanh nghiệp nhanh chóng nhận diện được các kênh hoặc nội dung có khả năng thu hút khách hàng mới, tạo nền tảng cho việc mở rộng tệp khách hàng tiềm năng.
Nhược điểm
First Touch dễ dẫn đến việc phân bổ ngân sách quá nhiều cho các kênh tạo nhận thức (awareness), mà bỏ sót vai trò của các hoạt động nuôi dưỡng và chuyển đổi khách hàng ở các giai đoạn sau. Ngoài ra, nó có thể khiến marketer hiểu sai hành vi khách hàng, tưởng rằng chuyển đổi xảy ra ngay từ lần đầu tương tác mà không cần các điểm chạm tiếp theo.
1.2. Last touch - Điểm chạm cuối cùng
Trái ngược với First Touch, mô hình Last Touch chỉ ghi nhận điểm tương tác cuối cùng ngay trước khi khách hàng thực hiện hành động chuyển đổi (thường là trở thành MQL). Mô hình này coi điểm chạm cuối là yếu tố then chốt thúc đẩy hành động của khách hàng.
Last Touch thường thích hợp để theo dõi các kênh chuyển đổi trực tiếp, được áp dụng để đánh giá hiệu quả của các nội dung hoặc kênh mang tính “chốt hạ” trong chiến dịch marketing như landing page, form đăng ký hay bài blog có CTA mạnh.
Ưu điểm
Mô hình đơn giản, dễ thiết lập và đặc biệt hữu ích trong việc xác định kênh hoặc nội dung chuyển đổi trực tiếp. Nó giúp marketer nhanh chóng xác định đâu là điểm chạm cuối cùng thúc đẩy khách hàng thực hiện hành động mong muốn.
Nhược điểm
Last Touch có xu hướng đánh giá quá cao vai trò của điểm chạm cuối cùng, trong khi bỏ qua toàn bộ quá trình nuôi dưỡng, xây dựng nhận thức và tạo lòng tin trước đó. Điều này dẫn đến cái nhìn phiến diện, làm mờ giá trị của các hoạt động marketing ở giai đoạn đầu và giữa hành trình khách hàng.
1.3. Linear Attribution – Phân bổ đồng đều cho mọi điểm chạm
Linear Attribution là mô hình phân bổ giá trị chuyển đổi bằng cách chia đều cho tất cả các điểm chạm mà khách hàng đã trải qua trong hành trình từ nhận diện ban đầu đến khi chuyển đổi. Mỗi điểm chạm được xem là đóng vai trò ngang nhau, không phân biệt mức độ tác động cụ thể.
Mô hình này phù hợp với các chiến dịch cần đánh giá tổng thể hành trình và muốn tránh thiên lệch vào một điểm chạm cụ thể, giúp marketer có góc nhìn cân bằng trong các hành trình đa kênh, đa điểm chạm.
Ưu điểm
Linear Attribution mang lại cái nhìn toàn diện và công bằng hơn so với các mô hình đơn giản như First-Touch hay Last-Touch, vì nó ghi nhận sự đóng góp của mọi điểm chạm trong hành trình. Điều này giúp doanh nghiệp không bỏ sót giá trị của các hoạt động trung gian vốn có vai trò hỗ trợ trong việc nuôi dưỡng và dẫn dắt khách hàng.
Nhược điểm
Điểm hạn chế lớn nhất của Linear Attribution là nó không phản ánh chính xác mức độ ảnh hưởng thực sự của từng điểm chạm. Trên thực tế, không phải điểm chạm nào cũng quan trọng như nhau, một số điểm có tác động mạnh hơn trong việc thúc đẩy khách hàng chuyển đổi, trong khi những điểm khác chỉ mang tính hỗ trợ.
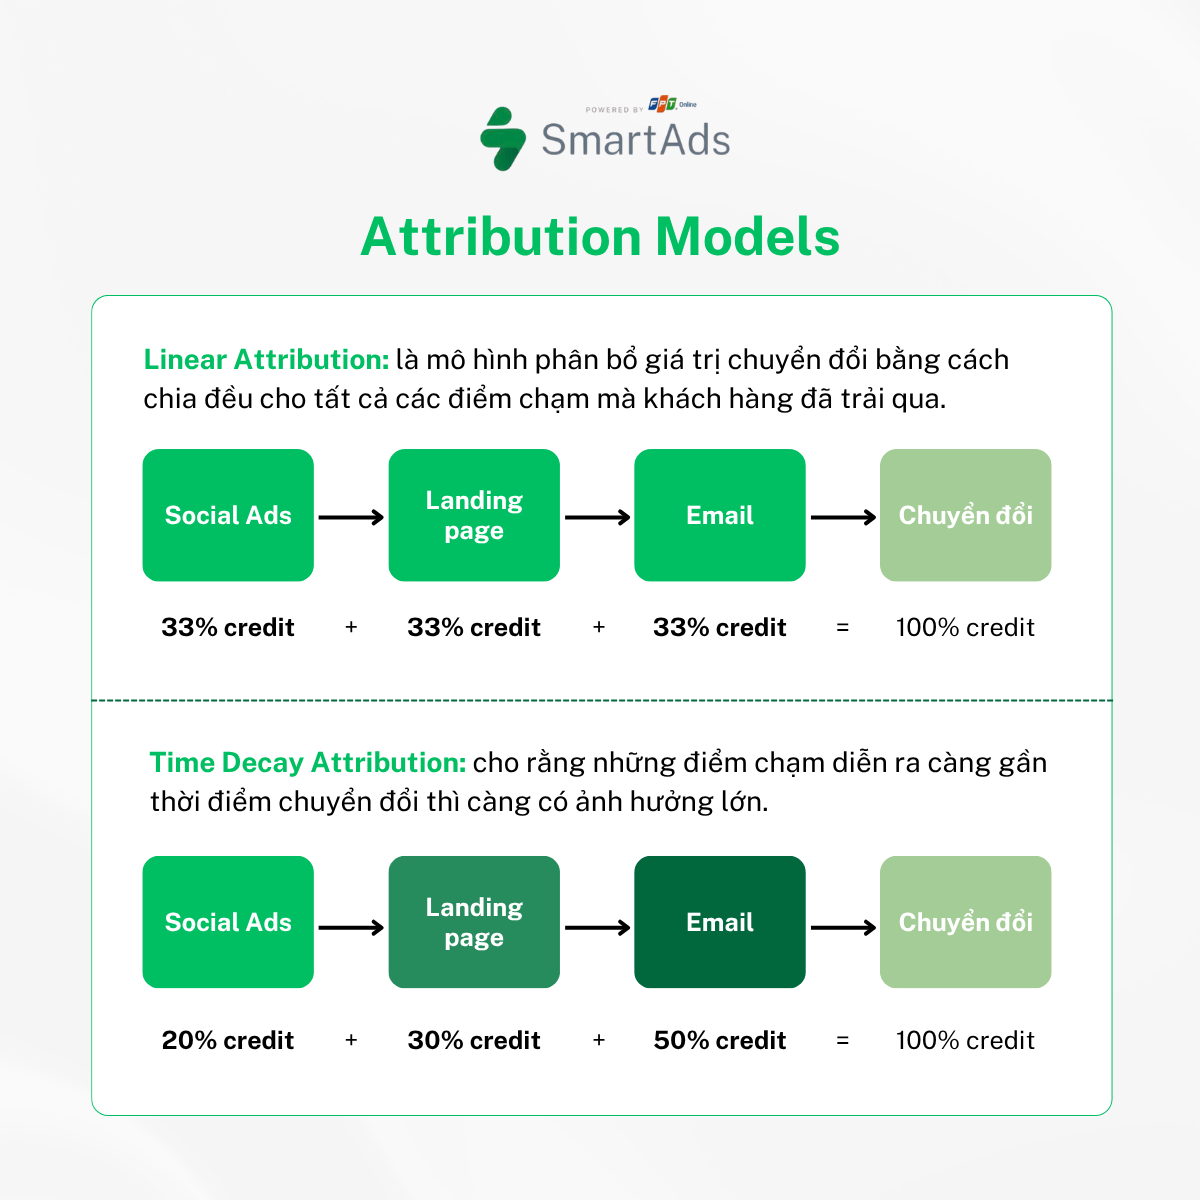
1.4. Time Decay Attribution – Ưu tiên các điểm chạm gần chuyển đổi
Time Decay Attribution cho rằng những điểm chạm diễn ra càng gần thời điểm chuyển đổi thì càng có ảnh hưởng lớn. Mô hình này sẽ gán tỷ trọng cao hơn cho các tương tác sau cùng trong hành trình khách hàng.
Mô hình này đặc biệt phù hợp với các chiến dịch marketing tập trung vào cuối phễu, chẳng hạn remarketing, nurturing hoặc email automation, nơi mục tiêu là đẩy khách hàng đến hành động cuối cùng.
Ưu điểm
Time Decay Attribution giúp doanh nghiệp tối ưu các hoạt động mang tính chất “chốt sale” hoặc chuyển đổi cuối phễu. Mô hình này làm nổi bật giá trị của các điểm chạm có tác dụng thúc đẩy khách hàng ra quyết định trong giai đoạn cuối hành trình.
Nhược điểm
Mô hình có xu hướng đánh giá thấp vai trò của các điểm chạm đầu hành trình — những điểm góp phần quan trọng trong việc tạo nhận thức và nuôi dưỡng nhu cầu của khách hàng. Điều này có thể dẫn đến nguy cơ doanh nghiệp cắt giảm ngân sách cho các hoạt động ở đầu phễu, làm suy yếu khả năng thu hút khách hàng mới về lâu dài.
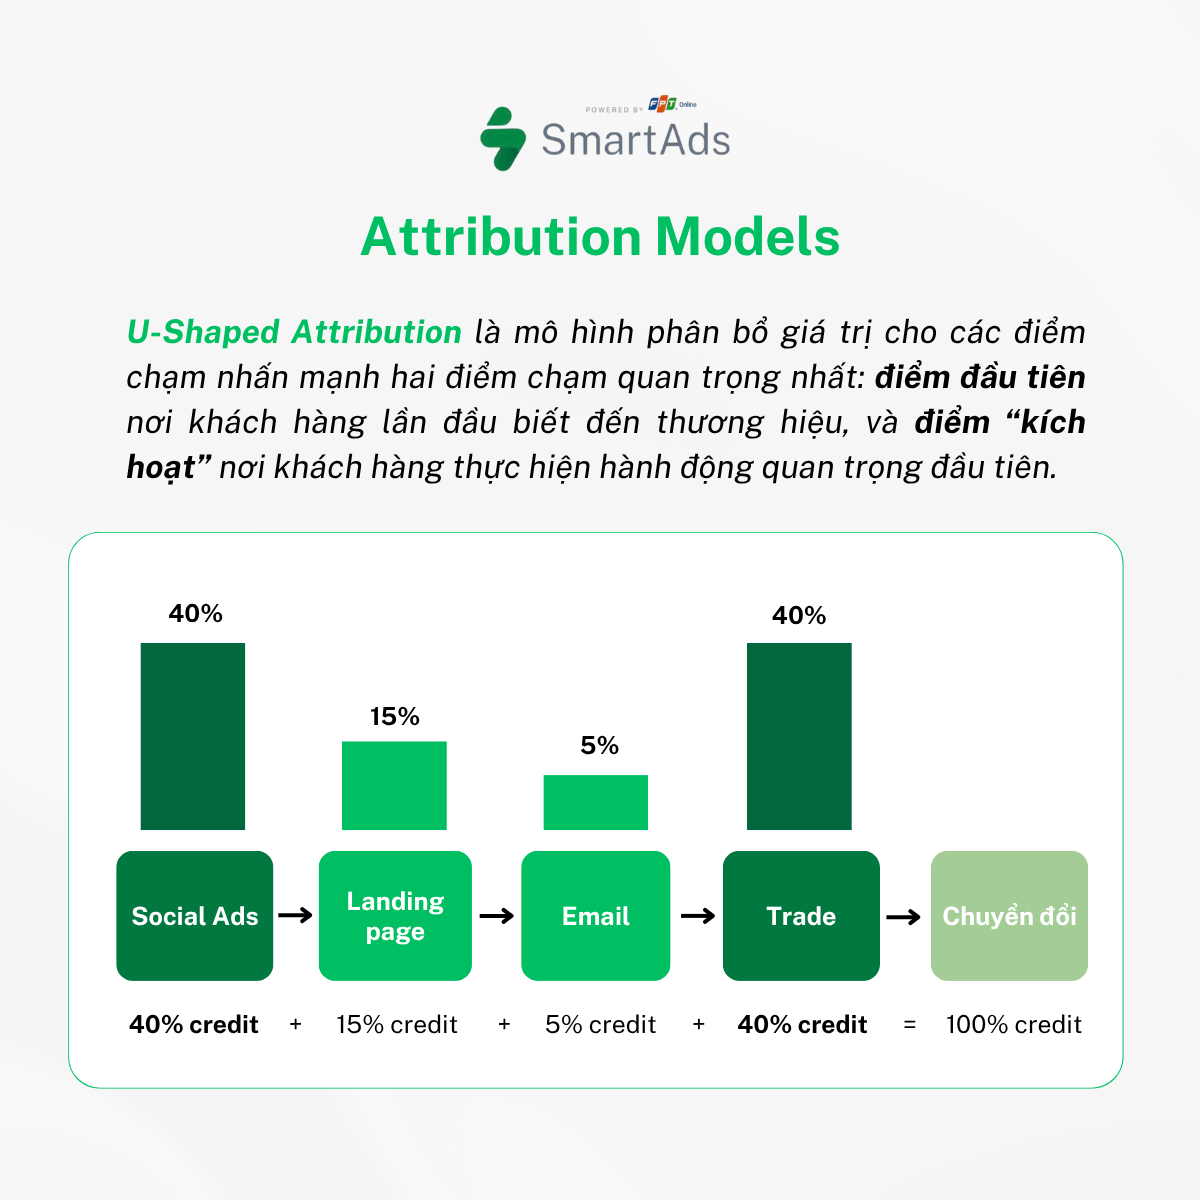
1.5. U-Shaped Attribution – Nhấn mạnh điểm đầu và điểm “kích hoạt”
U-Shaped Attribution là mô hình phân bổ giá trị cho các điểm chạm trong hành trình khách hàng, nhấn mạnh hai điểm chạm quan trọng nhất: điểm đầu tiên nơi khách hàng lần đầu biết đến thương hiệu, và điểm “kích hoạt” nơi khách hàng thực hiện hành động quan trọng đầu tiên (như điền form, đăng ký, trở thành marketing qualified lead – MQL). Phân bổ phổ biến của mô hình này là 40% giá trị cho điểm đầu, 40% cho điểm kích hoạt và 20% còn lại chia đều cho các điểm chạm trung gian.
U-Shaped Attribution đặc biệt phù hợp với các hành trình B2B hoặc hành trình dài hạn, nơi việc xây dựng nhận thức ban đầu và tạo ra hành động cam kết đầu tiên giữ vai trò then chốt trong việc dẫn dắt khách hàng tiến gần đến chuyển đổi.
Ưu điểm
Mô hình này giúp doanh nghiệp tập trung tối ưu các giai đoạn quan trọng nhất của hành trình khách hàng: giai đoạn thu hút nhận thức ban đầu và giai đoạn kích hoạt hành động chuyển đổi đầu tiên. Nhờ vậy, các chiến dịch có thể được điều chỉnh để gia tăng hiệu quả trong việc tạo lead chất lượng và thúc đẩy các cam kết ban đầu.
Nhược điểm
U-Shaped Attribution có thể bỏ qua hoặc đánh giá thấp vai trò thuyết phục âm thầm của các điểm chạm trung gian. Điều này trở nên hạn chế trong các ngành hoặc sản phẩm dịch vụ cần giáo dục khách hàng thông qua chuỗi nội dung phức tạp, nơi mà các điểm chạm giữa hành trình cũng đóng vai trò quan trọng trong việc nuôi dưỡng và chuyển đổi khách hàng.
2. Experiment - Phương pháp thử nghiệm
Experiment, phổ biến nhất là A/B Testing, là phương pháp đo lường hiệu quả giúp đo lường tác động cụ thể của từng yếu tố đến hành vi khách hàng. Phương pháp này đặc biệt phù hợp trong việc tối ưu các yếu tố giao diện, nội dung hoặc trải nghiệm người dùng trong chiến dịch marketing.
Phương pháp này được thực hiện bằng cách chia ngẫu nhiên nhóm khách hàng mục tiêu thành hai nhóm: nhóm A tiếp xúc với phiên bản gốc (ví dụ: website hiện tại, email hoặc quảng cáo đang chạy), trong khi nhóm B tiếp xúc với một phiên bản thử nghiệm (ví dụ: email với tiêu đề mới, trang đích với nút kêu gọi hành động màu khác). Sau quá trình tiếp xúc, dữ liệu của hai nhóm sẽ được so sánh để xác định biến thể nào hiệu quả hơn. Phương pháp này đặc biệt phù hợp trong các tình huống cần tối ưu chi tiết về giao diện, nội dung hoặc trải nghiệm người dùng ở cấp độ chiến thuật, ví dụ trong các chiến dịch email marketing, cải thiện tỷ lệ nhấp quảng cáo hay nâng cao tỷ lệ chuyển đổi trên website.
Ưu điểm
A/B Testing cho phép đo lường chính xác tác động của từng yếu tố trong hoạt động marketing, từ đó giúp marketer ra quyết định dựa trên dữ liệu thay vì cảm tính. Các yếu tố như tiêu đề email, màu sắc nút kêu gọi hành động (CTA), hay bố cục trang đích đều có thể được kiểm nghiệm để tìm ra phiên bản mang lại hiệu quả tối ưu, góp phần cải thiện chỉ số quan trọng như tỷ lệ mở email, tỷ lệ nhấp chuột hay tỷ lệ chuyển đổi.
Nhược điểm
Khi mở rộng quy mô thử nghiệm, A/B Testing dễ trở nên phức tạp và tốn kém, nhất là khi cần kiểm tra nhiều biến số cùng lúc. Điều này đòi hỏi cỡ mẫu đủ lớn, thời gian chạy thử nghiệm kéo dài và nguồn lực kỹ thuật đáng kể. Nếu không được thiết kế và kiểm soát chặt chẽ, các thử nghiệm có thể dẫn đến kết quả thiếu chính xác hoặc khó phân tích, gây lãng phí nguồn lực mà không mang lại giá trị thực sự.
3. Marketing Mix Modelling (MMM)
Marketing Mix Modeling (MMM) là phương pháp đo lường hiệu quả thông qua việc phân tích sử dụng dữ liệu tổng hợp cùng kỹ thuật thống kê hoặc máy học để đo lường tác động của các hoạt động marketing (quảng cáo, khuyến mãi, giá bán…) đến kết quả kinh doanh, ví dụ như doanh số, lượt cài đặt ứng dụng hoặc mức độ nhận biết thương hiệu.
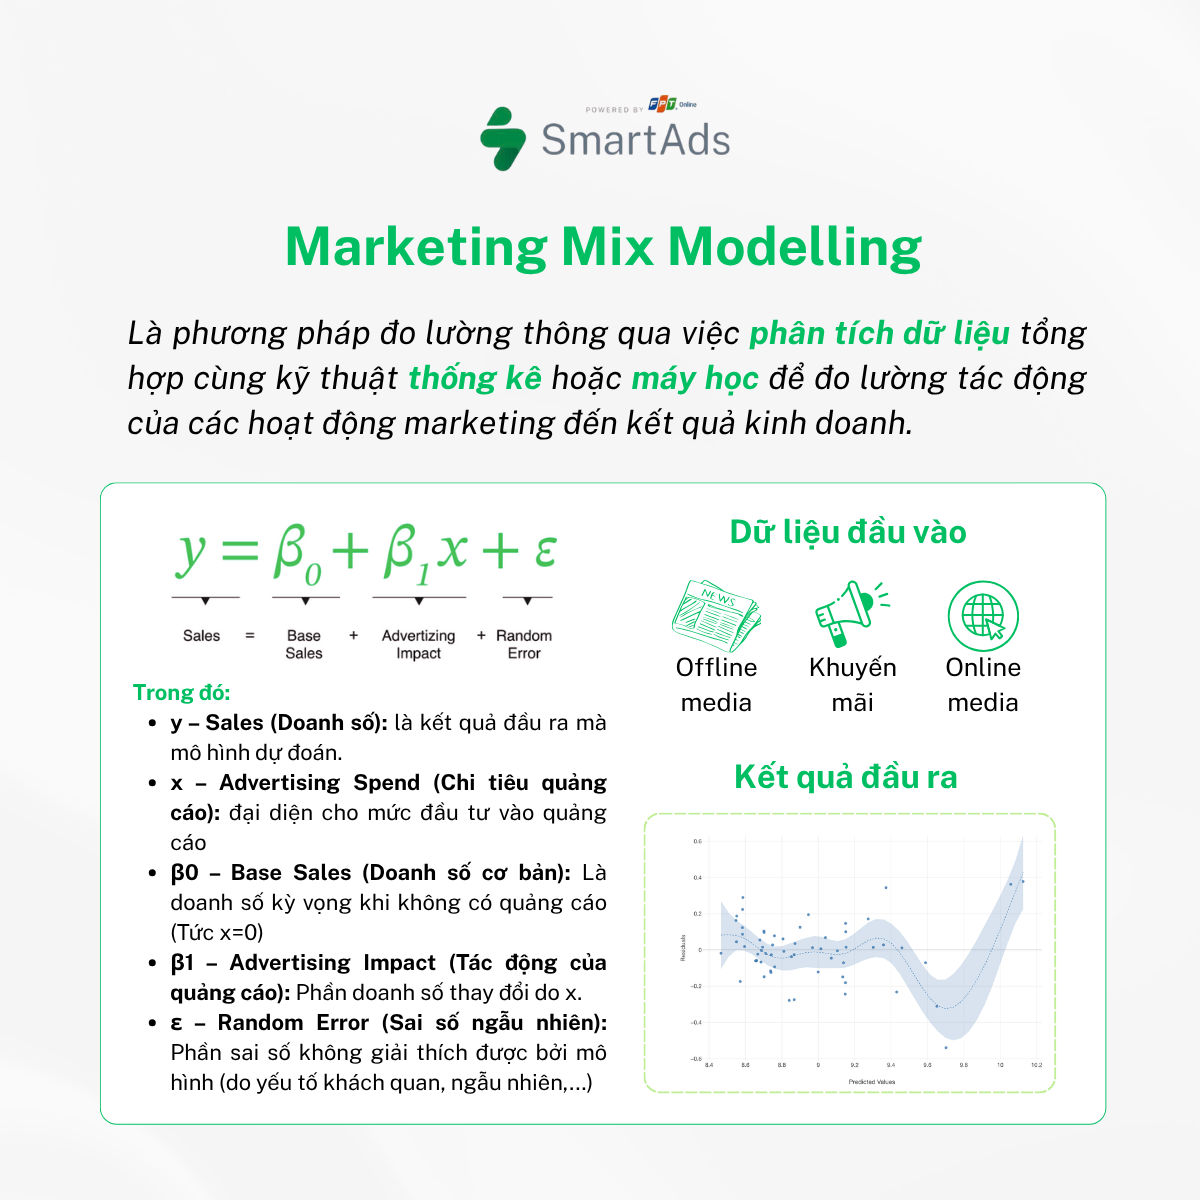
Công thức: y = β0 + β1x + ε
Trong đó:
-
y – Sales (Doanh số): Biến phụ thuộc, là kết quả đầu ra mà mô hình dự đoán.
-
x – Advertising Spend (Chi tiêu quảng cáo): Biến độc lập, đại diện cho mức đầu tư vào quảng cáo (có thể là ngân sách quảng cáo, số lần hiển thị, số chiến dịch...) và là yếu tố được dùng để giải thích và dự đoán doanh số.
-
β0 – Base Sales (Doanh số cơ bản): Là doanh số kỳ vọng khi không có quảng cáo (tức khi x=0x = 0x=0).
-
β1 – Advertising Impact (Tác động của quảng cáo): Phần doanh số thay đổi do chi tiêu quảng cáo. Đây là hệ số cho biết mỗi đơn vị chi cho quảng cáo làm tăng doanh số bao nhiêu đơn vị.
-
ε – Random Error (Sai số ngẫu nhiên): Phần sai số không giải thích được bởi mô hình (do yếu tố khách quan, biến không đo lường được, ngẫu nhiên...).
Ưu điểm
Marketing Mix Modeling (MMM) mang lại cho doanh nghiệp một góc nhìn toàn cảnh về hiệu quả đầu tư, cho phép đo lường đóng góp của từng yếu tố marketing, như quảng cáo, khuyến mãi hay giá bán, đến kết quả kinh doanh tổng thể. Nhờ sử dụng dữ liệu tổng hợp thay vì dữ liệu cá nhân, MMM giúp doanh nghiệp dễ dàng tuân thủ các quy định về quyền riêng tư như GDPR hay App Tracking Transparency. Bên cạnh đó, mô hình này còn hỗ trợ dự đoán hiệu quả đầu tư và tối ưu hóa ngân sách ở cấp độ chiến lược, từ đó giúp doanh nghiệp đưa ra quyết định phân bổ nguồn lực một cách chính xác và hiệu quả hơn.
Nhược điểm
Tuy nhiên vẫn tồn tại một số hạn chế mà doanh nghiệp cần cân nhắc khi áp dụng. Mô hình này khó xử lý chi tiết ở cấp độ vi mô, chẳng hạn như phân tích hiệu quả của từng nhóm quảng cáo hay từng nhóm đối tượng khách hàng cụ thể. Khi số lượng biến đầu vào quá nhiều hoặc dữ liệu không đủ chất lượng, độ chính xác của kết quả phân tích có thể bị giảm đáng kể. Ngoài ra, MMM đòi hỏi doanh nghiệp phải có dữ liệu lịch sử đầy đủ, chất lượng cao và cần thời gian tương đối dài để xây dựng và hiệu chỉnh mô hình nhằm đảm bảo tính chính xác và ổn định của kết quả.
Kết
Doanh nghiệp có thể kết hợp MMM với các phương pháp đo lường khác như Attribution model, thử nghiệm nhân quả (causal experiment) hoặc các chỉ số chiến dịch (brand lift), để khắc phục được ưu nhược điểm từng phương pháp từ đó xây dựng hệ thống ra quyết định dựa trên dữ liệu toàn diện.
Để phát huy tối đa giá trị từ các phương pháp này, việc lựa chọn công cụ phù hợp với mục tiêu doanh nghiệp là yếu tố then chốt để tối ưu nguồn lực và gia tăng giá trị đầu tư. Xuất phát từ nhu cầu này, SmartAds phát triển giải pháp Brandformance, kết hợp giữa xây dựng thương hiệu và tối ưu hiệu suất. Dựa trên dữ liệu độc giả từ các nền tảng truyền thông uy tín, giải pháp kỳ vọng giúp doanh nghiệp tiếp cận đúng khách hàng tiềm năng và nâng cao tỷ lệ chuyển đổi với chi phí tối ưu.