1. What are attention metrics? Concept and the ARF (Ad Response Model)
Attention metrics are indicators that reflect the level of focus, attention, and genuine interaction users have with advertising. Rather than simply measuring whether an ad is visible, attention metrics evaluate whether users actually read, watch, engage with, and remember the message. In today’s digital environment, where audiences are constantly distracted by an overwhelming volume of content, user attention has become a “golden asset” that ultimately determines advertising effectiveness.
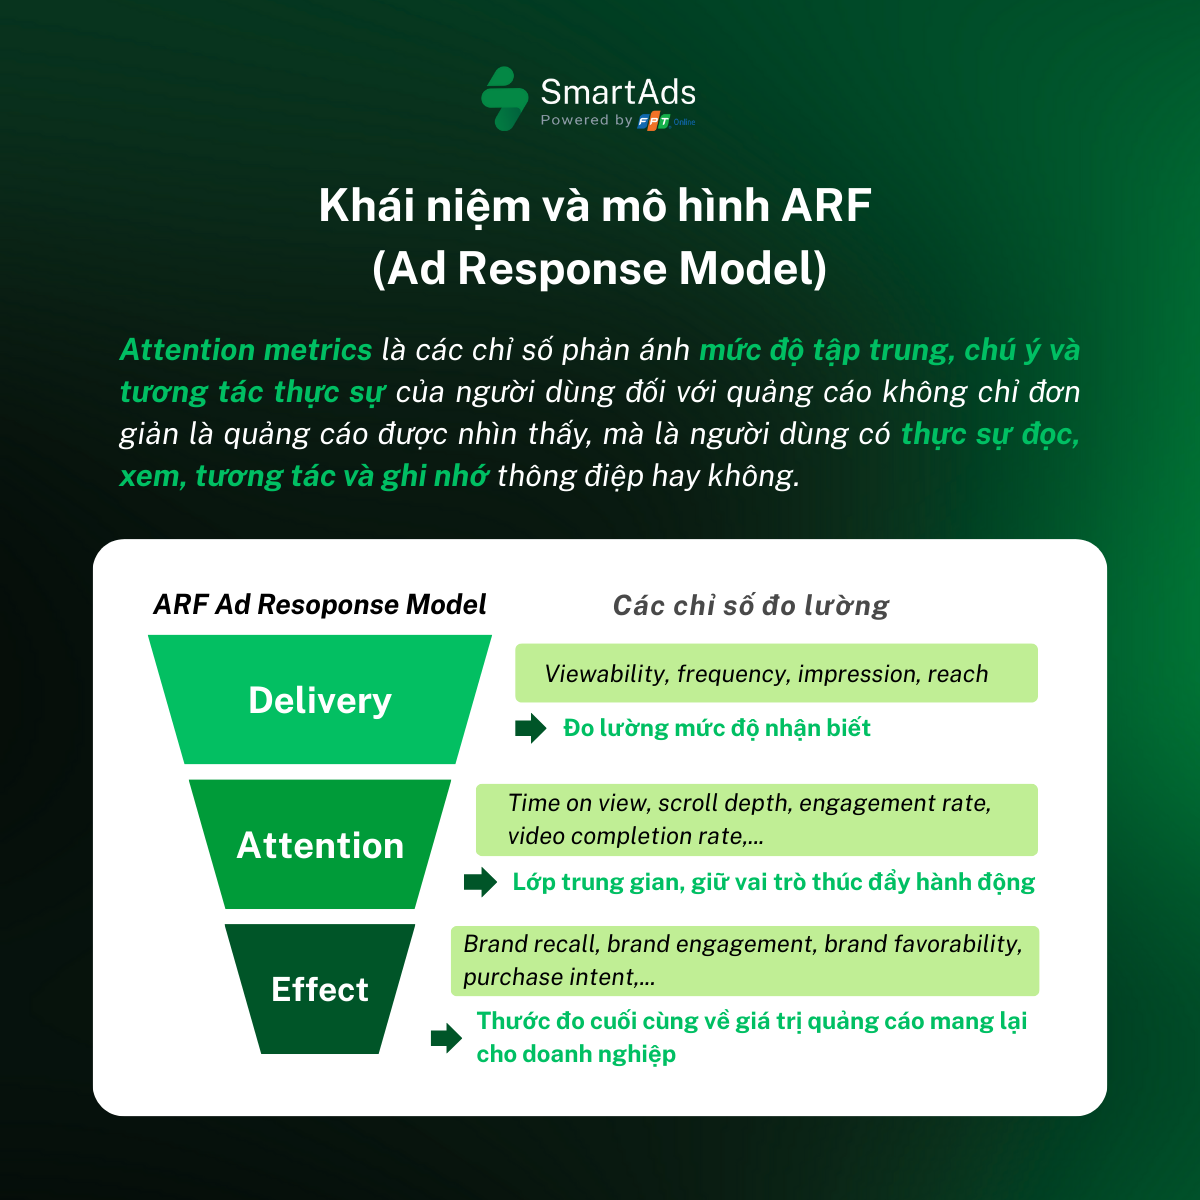
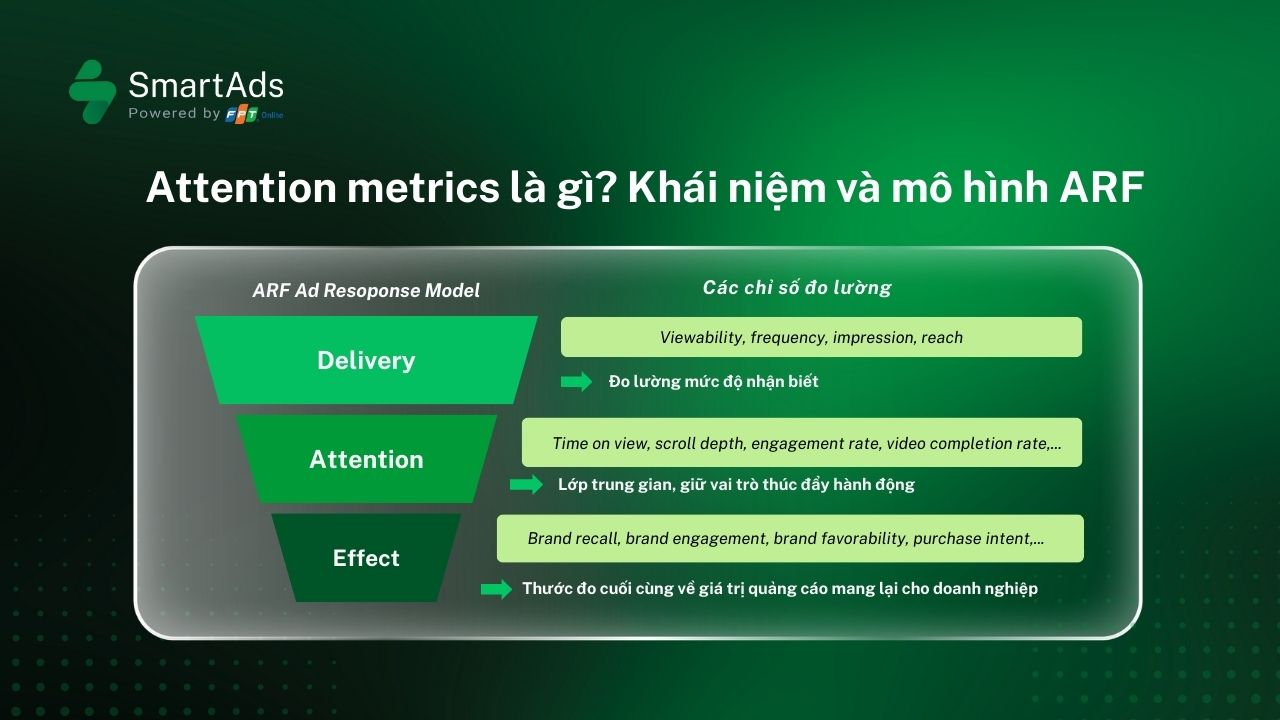
According to Kantar’s ARF (Ad Response Model), attention functions as the critical gateway across three layers, determining whether an ad merely exists as an impression or progresses toward delivering real impact. Specifically:
-
Top layer: Delivery (Ad Distribution / Exposure): This is the foundational stage that determines whether an ad is actually delivered to users. Examples include whether the ad appears on screen, is placed within content feeds, or is distributed to the intended target audience. Performance at this level is typically measured using basic metrics such as impressions, viewability, frequency, and reach. However, this only reflects presence — it does not guarantee meaningful user impact.
-
Middle layer: Attention (User Attention): This is the most critical layer, as not every visible ad earns attention. Advertising only generates value when users pause, look, or interact with the content. Metrics commonly tracked at this stage include time spent, scroll stop rate, video completion rate, engagement rate, and more advanced indicators such as eye-tracking or attention scores. This layer serves as the decisive gateway that determines whether an ad can move forward to deliver impact.
-
Final layer: Effect (Advertising Impact): Once attention is secured, advertising can drive tangible outcomes such as shifts in brand perception, formation of positive associations, or increased purchase intent and behavior. At this stage, effectiveness is measured through metrics like brand recall, brand engagement, brand favorability, purchase intent, and ultimately sales uplift. These indicators represent the final measure of value that advertising delivers to businesses.
Additionally, as data privacy becomes increasingly important, attention-based measurement relies on data signals that can be collected without cookies or device IDs. This approach aligns with global regulations such as the General Data Protection Regulation (GDPR) and the California Consumer Privacy Act (CCPA).
>>> What is the path forward for advertising in a cookieless world? Explore now.
2. Attention metrics and their relationship within the Hierarchy of Attention
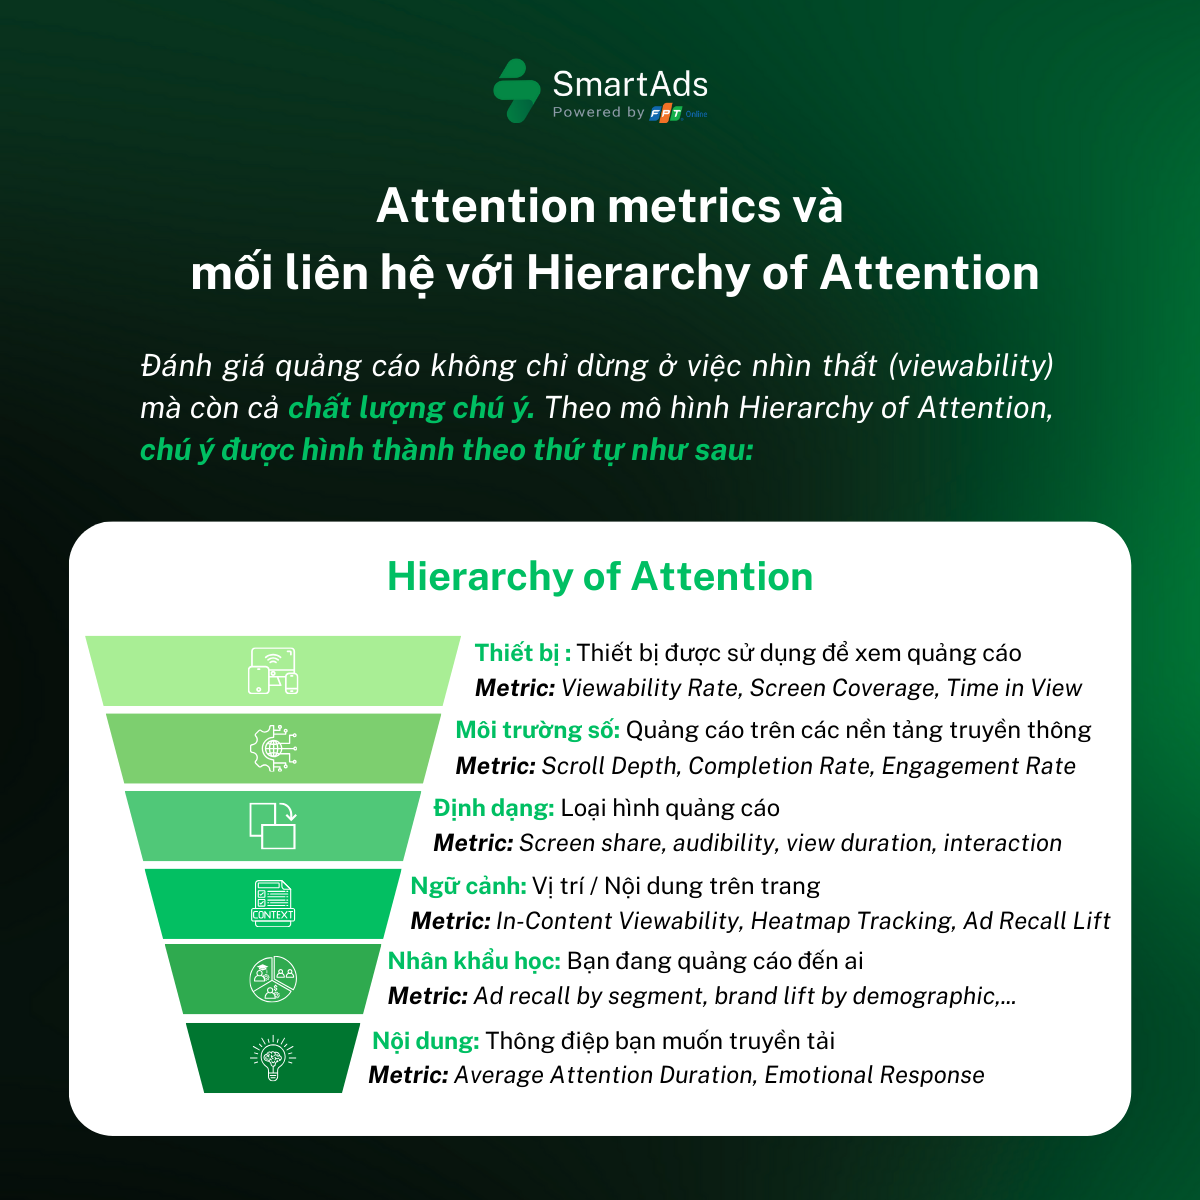
When evaluating advertising effectiveness, marketers should not only consider whether ads are viewable, but also assess the quality of user attention. According to the Hierarchy of Attention model, attention is formed and measured in a structured sequence — starting from device, digital environment, ad format, context, demographics, and ultimately creative content. Accordingly, attention metrics vary depending on each factor:
2.1. Device
-
Key metrics: Viewability Rate, Screen Coverage, Time in View.
-
Ads on smaller devices such as mobile often achieve higher viewability due to focused screen space, but attention duration may be shorter. In contrast, Connected TV (CTV) typically delivers longer viewing time with fewer distractions.
2.2. Digital Environment
-
Key metrics: Scroll Depth, Completion Rate, Engagement Rate.
-
Video ads on platforms like YouTube are often evaluated by completion rate, while native ads on news sites are more closely linked to scroll depth — indicating whether users scroll far enough to consume the full content.
2.3. Format
Attention measurement varies by ad format. Below are several representative examples:
-
Display ads: metrics include time in view, screen share, and interaction counts, helping determine whether ads are truly seen and whether users respond directly.
-
Video ads: metrics include video completion rate, audibility, view duration, and actions such as play, pause, or volume adjustment. These indicators measure both visual and audio attention, reflecting deeper engagement quality.
-
Mobile ads: metrics include tap interactions, scroll depth, and screen orientation changes, capturing highly personal and direct user behavior.
-
Connected TV (CTV) ads: metrics include video completion rate, channel switching behavior, and remote interactions, reflecting sustained attention in low-distraction environments.
2.4. Context
-
Key metrics: In-Content Viewability, Heatmap Tracking, Ad Recall Lift.
-
Ads embedded within editorial content tend to deliver higher ad recall lift. Heatmaps help identify which on-page areas capture the most user attention.
2.5. Demographic
-
Key metrics: Ad Recall by Segment, Brand Lift by Demographic, Engagement Rate by Age/Gender.
-
Ad recall and engagement vary by age group, generation, gender, and location. For example, Gen Z typically engages more with short-form video, while older audiences maintain longer attention spans for traditional TV commercials.
2.6. Creative (Ad Content)
-
Key metrics: Average Attention Duration, Message Recall, Emotional Response.
-
These are the most core and critical metrics determining whether an ad can truly “hold” audience attention. A compelling creative helps increase average attention duration, while also generating positive emotional response, thereby strengthening message recall.
3. Methods for measuring attention metrics
3.1. Overview of Measurement Approaches
Attention in advertising is measured through four primary approaches, each with its own methodology and application:
- Visual / Audio Tracking: Uses technologies such as eye-tracking, facial coding, or audio analysis to identify where users focus and how they respond to ads. This method is well-suited for measuring visual attention and emotional reactions but requires specialized equipment.
- Physiological / Neurological Observation: Measures physical responses such as heart rate, blood pressure, or brain waves to assess attention levels and emotional engagement. This approach provides deep insights into unconscious reactions but is difficult to deploy at scale.
- Data Signals: Collects data from devices, ad placements, and metadata to evaluate visibility and interaction. This is the most widely used approach due to its ease of implementation and scalability.
- Survey-Based Methods: Relies on self-reported data from online surveys or in-depth interviews to assess brand health. While providing subjective insights, this method may be affected by respondent bias.
Among these four approaches, each has its own strengths and limitations depending on the measurement objectives and scope. For short-term, rapid advertising effectiveness evaluation, data-signal-based measurement is often prioritized over the other three approaches.
3.2. What defines high-quality advertising data signals?
An advertising data signal is considered “high-quality” when it accurately reflects user attention and has predictive power across corresponding metrics at different stages of the measurement funnel. Below are key data signals marketers should monitor to optimize advertising performance:
- Viewability: Typically, a viewability rate above 70% indicates that the ad appears within the user’s visible area, increasing the likelihood of attention if the creative is sufficiently engaging. If most ads are hidden below the fold or displayed for too short a duration (<1 second), users have little to no real opportunity for exposure.
- CTR: A high CTR combined with strong conversions suggests accurate targeting and relevant messaging. Conversely, an extremely low CTR (<0.1%) indicates poor ad quality; while an unusually high CTR with zero conversions—especially when paired with high bounce rates and very low time-on-site (<1s)—may signal bot traffic or click fraud, potentially wasting ad spend.
- Scroll Depth: reflects how far users scroll down a page. For landing pages, higher scroll depth is considered better. When combined with sufficient time-on-site, it indicates that the page is engaging and that users are genuinely interested in the product and content.
- Video Completion Rate: reflects the percentage of users who watch a video in full. A high rate indicates that users are not just glancing at the ad but are spending time watching it entirely, signaling strong appeal and clear message delivery. When this metric is low, users drop off before completion, leading systems to interpret the content as less relevant—potentially lowering quality scores and increasing CPC.
>>> Explore more key metrics for video ads here.
- Interaction / Engagement: Includes tracking user actions such as clicks, hovers, banner expansions, video play events, or scroll interactions. Interaction represents the highest validation stage in the attention ladder from see → pause → pay attention → take action. Ads with strong interaction and engagement metrics demonstrate that users are not only “seeing” the content but are genuinely interested—indicating potential future customers.
Conclusion
Attention-based advertising measurement models are evolving rapidly under the influence of AI and machine learning. These technologies play a central role by enabling the collection and processing of massive data sets, delivering real-time insights and feedback on consumer behavior, preferences, and engagement levels.
By applying these technologies, brands can comprehensively optimize their advertising campaigns on the SmartAds platform. SmartAds not only tracks a wide range of attention metrics—from viewability, scroll depth, and video completion rate to engagement—but also provides automated real-time dashboards. This enables marketers to easily evaluate campaign performance and adjust strategies accordingly.